Understanding the Basic idea of Fibonacci Retracement Levels to use as a Trading Strategy
.png)
Background Image Source- Canva.com/Location

Assalam-o-Alaikum Steemians !
I'm @moneyster, a professional level Cryptocurrency investor and an analyser. As usual, today I thought to share another Crypto-related experience with you. I hope this article will be considerably beneficial for all the Steemians in this community
.gif)
 |
|---|
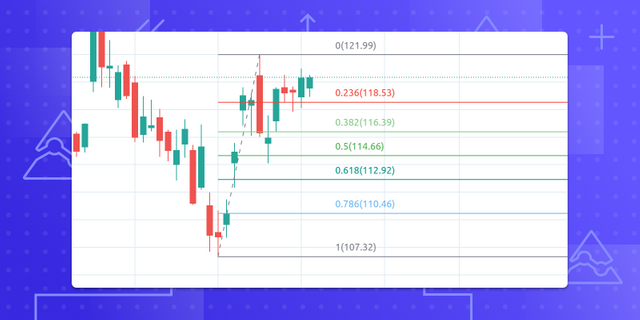
Fibonacci Retracement Levels can be defined as very useful levels that we can find through a specific indicator which is already integrated into our Trading Window. With the help of these specific levels, we have the ability to predict suitable reversal points in the market with a certain accuracy.
Most Crypto Traders are using this amazing tool as a supportive indicator for Trend Trading. The basic procedure of this Fibonacci Retracement is drawing the Fib line across a selected price range and identifying suitable support or resistance zones within the highlighted points by the Fibonacci Retracement Levels.
Here the different Traders have their own preferred zones in these Fibonacci Retracement Levels such as 0.382 and 0.618. At the same time, one of the most famous Fibonacci Retracement levels is the area between 0.65 and 0.618 and it is also known as the Golden pocket. Many Traders consider this level as a strong support level for a Bear movement or a strong resistance level for a bullish movement.
At the same time, the Fibonacci Retracement level of 0.618 level is the point which we define as the Golden Ratio. There is an interesting theory for calculating these levels. We will further discuss that Theory and calculations in a different article.
With the help of these Fibonacci Retracement Levels, we can easily identify considerable support zones in the Chart. At the same time, we have the ability to identify suitable resistance zones within a specific range. The most interesting thing about this tool is that here we have the ability to predict the future behaviour of a coin or token which has now passed its all-time high. Then, we can find a suitable zone for selling our Tokens or coins with the help of the Fibonacci Retracement Levels.
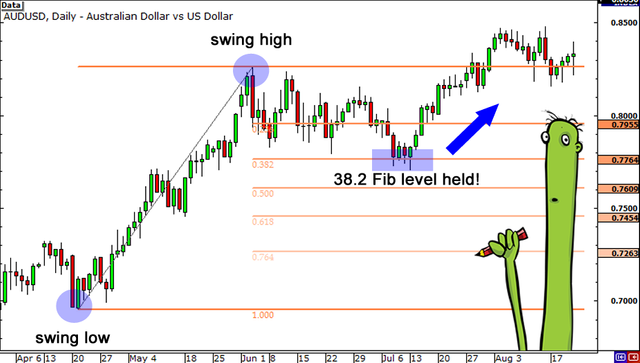
As an example, we already know that we always try to predict the behaviour of the Market by comparing present data with the past data or past market movements. So, we can easily do this by drawing support or resistance zones in the chart or we can also use some famous indicators to do it. But, if the relevant Coin or Token is walking on its all-time high, it is quite difficult to predict the exact reversal point of that project. Because that price level can't be compared with the past price movements. At this time, Fibonacci Retracement Levels come to this point and we can easily draw a Fibonacci Retracement Line and identify the suitable zones with the help of specific calculations.
Here I will give only the basic idea of Fibonacci Retracement Levels and there are a lot of other advanced methods to work with these Fibonacci Retracement Levels.
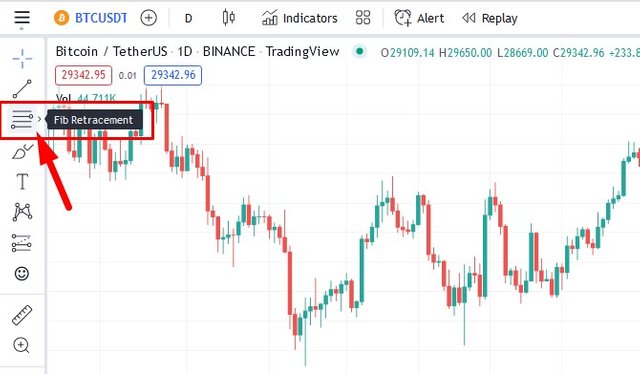
First of all, we need to find a specific range of the price movement to find suitable support or resistance levels in the market. At the same time, we need to choose a suitable Time frame in which we can see the entire price movement in a clear view. Then we select the Fibonacci Retracement Indicator from the Tool panel.
Below I have demonstrated the procedure for adding the Fibonacci Retracement indicator through the Tradingview chart. Here you can clearly see the Fibonacci Retracement tool in the left tool panel and we have to click on it.
 |
|---|
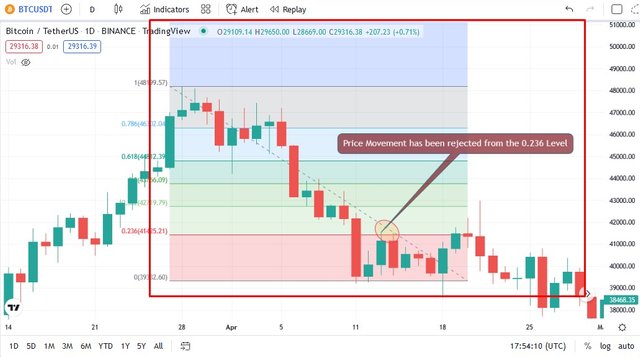
After selecting the Fibonacci Retracement tool, we need to draw a line across the entire price movement like the below-attached screenshot. Here I have demonstrated a suitable resistance zone which I got with the help of Fibonacci Retracement Levels. Here you can clearly see the price movement has clearly rejected from these levels.
 |
|---|
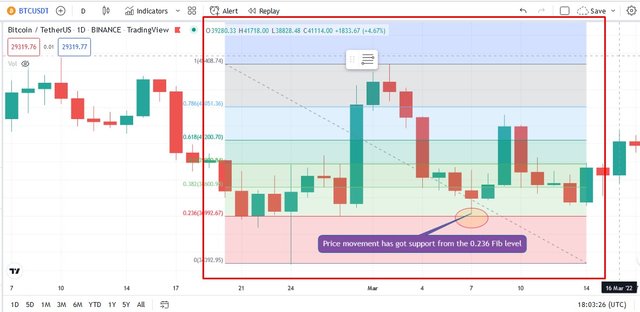
Now let's see the opposite incident with this Fibonacci Retracement level. Here I have demonstrated a suitable support zone which I got with the help of Fibonacci Retracement Levels. Here you can clearly see the price movement has clearly bounced from these levels.
 |
|---|
In this way, we can use this Fibonacci Retracement tool to get better and easy trading opportunities. However, we should always try to combine this strategy with some other indicators to increase the winning percentage.
At the same time, as I said in my previous article, we should remember that all the indicators and strategies are not efficient completely as nothing we can find 100% efficient in the world. So, we should depend only on these strategies and indicators to confirm our trading opportunities.
I have studied the below-sourced articles to further study these topics and I have explained all the above facts in my own words and experience.
10% benificiary set for @tron-fan-club
Twitter Shared
https://twitter.com/moneyster12/status/1529166399901417473?s=20&t=K-NN2TmJbBcYCEwgHzgySQ
In my oppinion, Fibonnaci retracement is just some psychological zones that have no real meaning. I can retrofit any number of divisions as support or resistance levels of a price movement. I prefer using Murrey Math to see potential value levels.
You are correct my brother. Thank you very much for adding such wonderful details to my article. It really increases the value of this presentation.
You've explained Fibonacci Retracement Levels and how traders can utilize it to make the best trading decision.
Thank you for sharing
You are most welcome. hope you really enjoyed it. Stay with me to see a lot of valuable articles within this community. Thank you very much for your valuable comment.
Note: You must enter the tag #fintech among the first 4 tags for your post to be reviewed.
Thank you very much @nane15 for your cooperation. It means lot to me.
Fibonacci isn't so easy to understand but you have done a great deal in being explicit in your explainations. Thank you so much for that.
You are correct. It isn't so easy to understand. But it is a very good tactic to use when Trading. Thank you very much for your valuable comment.
This is a great piece of information, rt thanks for sharing
You are most welcome. It means a lot to me.