How to Find Suitable Support and Resistance level with the help of a Single Indicator
.png)
Background Image Source- Canva.com/Location

Assalam-o-Alaikum Steemians !
I'm @moneyster, a professional level Cryptocurrency investor and an analyser. As usual, today I thought to share another Crypto-related experience with you. I hope this article will be considerably beneficial for all the Steemians in this community
.gif)
 |
|---|
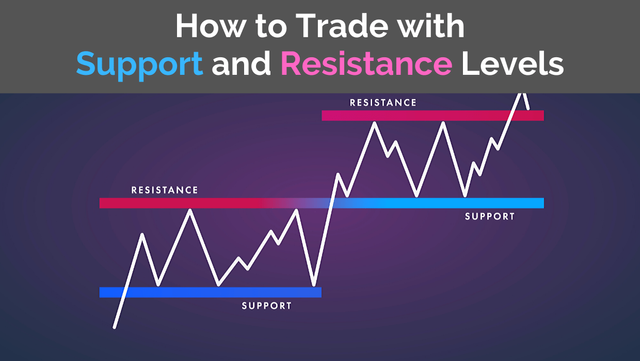
I think we already have a Good idea about Support and Resistance levels in a chart. Simply, we have to compare and present price data to identify these specific support and resistance zones in a relevant Crypto chart.
But, sometimes it is not easy to find these exact support or resistance zones in a chart. Because everyone doesn't look at the chart patterns in an equivalent manner. Therefore, all the identified support or level can be weak as compared to other person's view.
As a solution for the above-mentioned issue, Some professional Traders have created and published some useful indicators which we can use for identifying each support or resistance level in a very easy manner. This indicator is known as the Support and Resistance Levels with Breaks indicator.
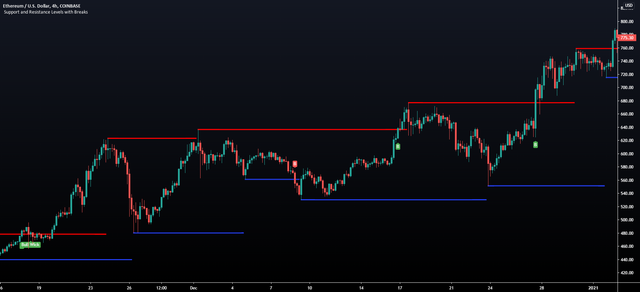
With the help of this indicator, we have the ability to analyze our Crypto charts with some extra and effective support or resistance zones. It means, we can see all the Support or Resistance zones are already highlighted in the chart after adding this indicator to our Crypto chart.
Basically, here they have given a Blue Color line for the Support Levels and a Red Color Line for Resistance levels as the default settings of this indicator. However, we can customize those settings according to our choice.
In addition to that, they have also introduced some Breakout Points in this indicator to Take our Entries very effective manner. As an example, when the Price level Breaks a resistance level properly with a suitable Bullish candle, it shows a Green "B" icon under the relevant candle in the chart. At the same time, when the Price level Breaks a support level properly with a suitable Bearish candle, it shows a Red"B" icon above the relevant bearish candle in the chart.
As I said before, Support and Resistance Levels are doing a significant contribution to the Technical analysis part of Cryptocurrency. Therefore, we can't forget the support and resistance levels when we need to buy or sell Crypto assets in a quite effective manner. However, this special "Support and Resistance Levels with Breaks" indicator provides better smooth and additional suitable support or resistance levels very clearly in the chart. With the help of this indicator, we have the ability to Find exact entry or exit points in the chart by looking at "B" signals given by the indicator. Therefore, even a newcomer to the Crypto field can easily handle this indicator very effectively without much knowledge about Technical analysis. As this is a single indicator, we don't need to work with too many indicators in a very busy chart window.
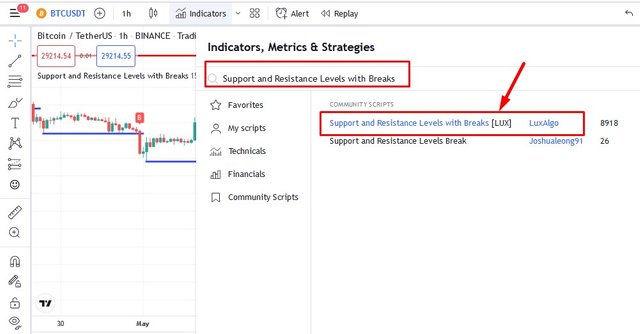
First of all, I will add this Support and Resistance Levels with Breaks indicator to my Crypto Chart using the TradingView platform. Then we can go to "Indicators" thought to tool panels and search "Support and Resistance Levels with Breaks" in the giver search bar. Below I have included a screenshot to demonstrate adding the Support and Resistance Levels with Breaks indicator to our chart.
 |
|---|
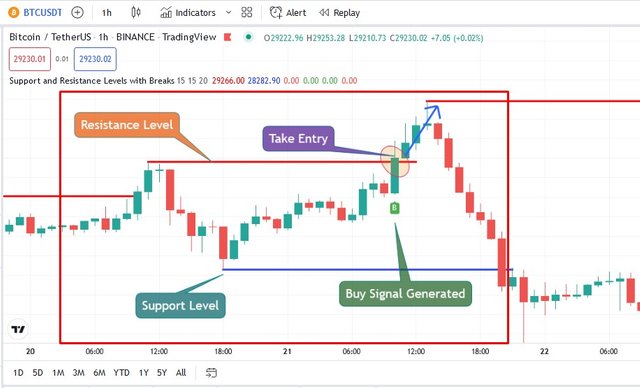
Below I have demonstrated some good zones which provided by this Support and Resistance levels with Breaks indicator. Here we can see good zones to buy our assets or take a buy entry through the Green "B" signals generated by this indicator.
 |
|---|
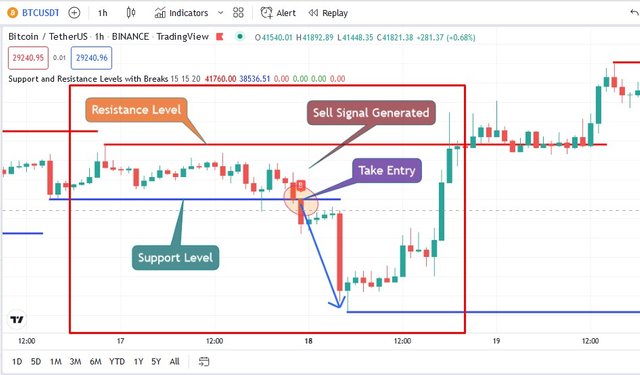
Below I have demonstrated some good zones which provided by this Support and Resistance levels with Breaks indicator. Here we can see good zones to sell our assets or take a sell entry through the Red "B" signals generated by this indicator.
 |
|---|
In this way, we can use these Support and Resistance Levels with Breaks indicators for getting better and easy trading opportunities. However, we can try to combine this strategy with some other indicators to increase the winning percentage.
At the same time, as I said in my previous article, we should remember that all the indicators and strategies are not efficient completely as nothing we can find 100% efficient in the world. So, we should depend only on these strategies and indicators to confirm our trading opportunities.
I have studied the below-sourced articles to further study these topics and I have explained all the above facts in my own words and experience.
10% benificiary set for @tron-fan-club
Twitter Shared
https://twitter.com/moneyster12/status/1530981042714206208?s=20&t=vGb3hRiJIV8MFFJrvOrB0Q
Finding support and resistance is the basics of technical analysis and it is a good thing you have taken out time to write on it.
Thank you.
Thank you very much for your valuable comment. Yeah it is the basics of technical analysis. Also important for all the traders.
very good indicator but until now i haven't learned much into it because i use swap more
You can test it using the Paper Trading method. I think that is the best option to practice trading and testing an Indicator.
although it's still difficult to understand, but this is worth learning
Support and Resistance is a very common indicator and should be applied when doing any analysis. Thank you for sharing.
Of course, those are very common. But strong facts to determine the market behavior. Thanks a lot for the valuable comment.
I really learn a lot from your post. Good job
Thank you very much for visiting my article. It means a lot to me.
You are welcome