POPULAR CANDLESTICK PATTERNS USED IN TECHNICAL ANALYSIS
Greetings,
It's your friend @mondraye and today I would be sharing another important content on candlestick patterns.
The price action is said to be the basics of technical analysis with the use of indicators being secondary. In as much as this is true, the price action technique won't really be complete without mentioning candlesticks and this explains why i will be showing us some popular candlestick patterns used in technical analysis.
The candlestick patterns are patterns used by traders in identifying areas of opportunity on the price chart. It helps to understand the situation of the market by providing clarity of event between buyers and sellers. And it is also beneficial to scalpers, swing, and long term traders.
This candlestick patterns can be categorized based on use and significance and this draws out three major categories which includes;
- Bullish reversal pattern
- Bearish reversal pattern
- Continuation pattern/indecision
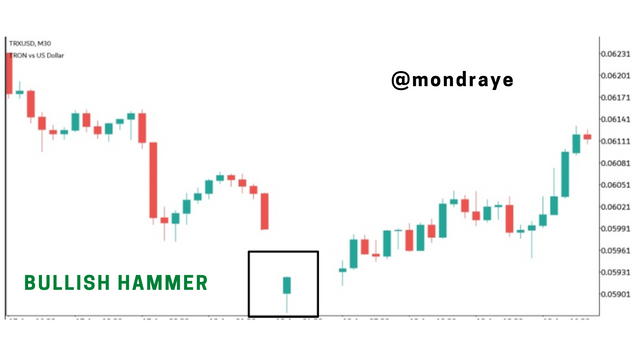
- Hammer head
Hammers are indication of price intervention from either sellers or buyers. In a bearish trend, a formation of bullish hammers may indicate that buyers are begining to strongly oppose the sellers by being able to drive the price back up and close above the opening.
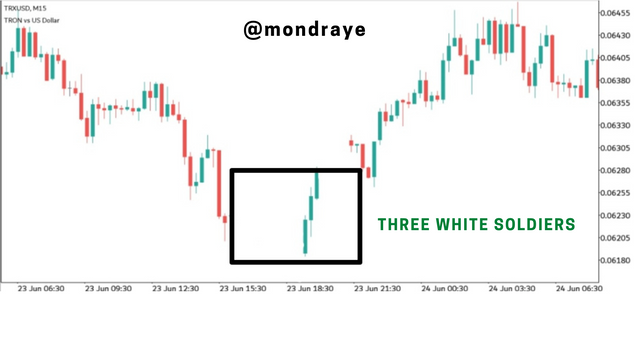
- Three white soldiers
The three white soldiers is the formation of three candlesticks which closes at a point above the previous candles. This candles shows that buyers have likely taken control of the current market.
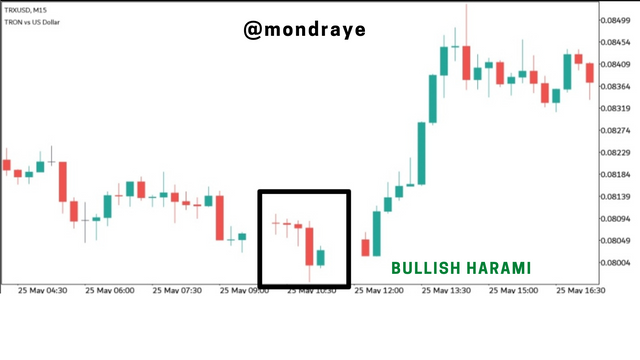
- Bullish harami
Bullish harami is a continuous red candle followed by a small green candle which is contained within the body of the preceeding red candle.
This formation indicates that the bearish momentum have reduced and a possible bulliah movement is expected.
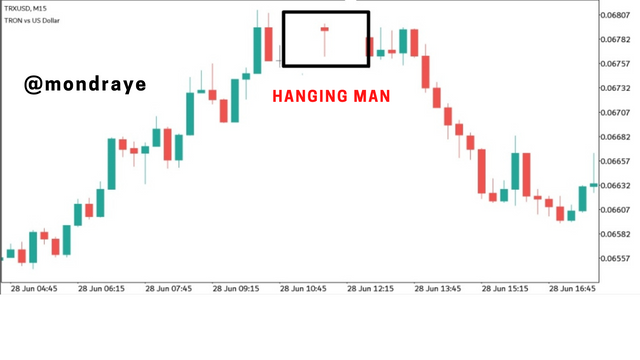
- Hanging man
Hanging man is the opposite of bullish hammer head. It is usually formed at the top of an uptrend indicating an obvious struggle from sellers in trying to push the price down. The effect is seen on a long wicked candle which manages to close just below the open.
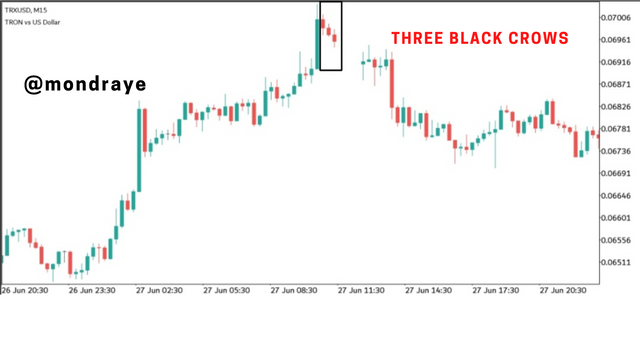
- Three black crows
The three black crows is a bearish reversal candle that takes the pattern of a step. It comprises of a three bearish candles with each opening at the body of the preceeding candle and closing below it.
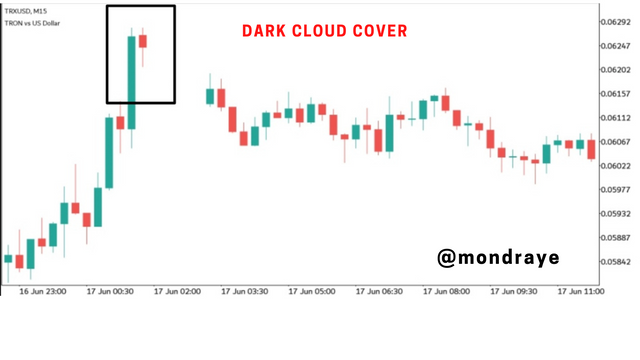
- Dark cloud cover
The dark cloud cover is a bearish reversal candlestick pattern that is indicated by the formation of a bearish candle that opens above thd close of a preceeding bullish candle. This bearish candle closes at the mid-point of the preceeding bullish candle and it is often followed by the shift in momentum on the downside.
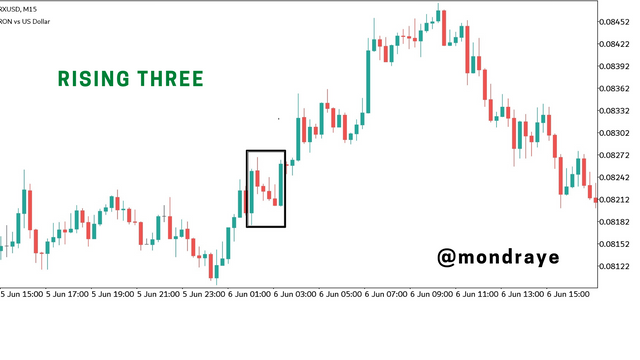
- Rising three
This pattern occurs in an uptrend and it is indicated by the formation of three or more small bearish candles that is followed by a big fat bullish candle which engulfs the three bearish candles and thus making the price continue in an uptrend.
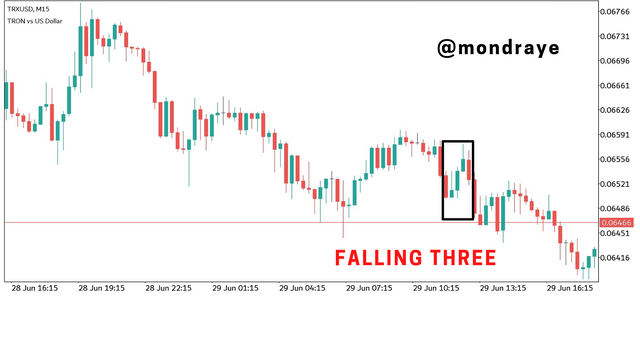
- Falling three
The falling three pattern is the opposite of the rising three. It occurs during a downtrend movement and it is indicated by the formation of small three or more bullish candles following a large bearish candle that engulfs them thus making the price continue on a downtrend.
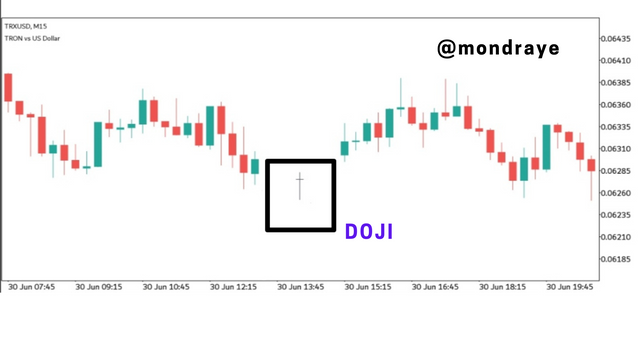
- Doji
The Doji pattern is mostly described to be as a result of market indecision. This causes pride to close at the open or very close to it thus formation a long wick and a very tiny body.
Summary,
The candlestick pattern have been long used by traders in analyzing possible price direction. This patterns are believed to represent activities going on between buyers and sellers which will in turn help to predict what the outcome might be.
The candlestick patterns are not efficient enough to independently predict market movements which explains why it is best to combined with other technicals analysis tools in other to increase efficiency and reduce false signals.
All photos used on this post are original screenshots from my MT5 trading account on a Trx|USDT pair.
10% to @Tron-Fan-Club
Tweet link
https://twitter.com/SonOfMaaan/status/1543997101104832518?s=19
very interesting explanation about candles and not everyone can understand it well
Thank you.
My focus was to make it as explicit as possible for easy understanding
Thank you very much
I love your explination. Even the images helps me to understand more.
Thank you. The images were from a live chart.
My aim is to let readers know that those patterns are always seen on live charts not just online.
It is important to know the candles pattern to better predict the market.
Yes it is. It is part of the basics