Trading Steem with the Wyckoff Method
Hello everyone! I hope you will be good. Today I am here to participate in the contest of Steemit Crypto Academy about the Trading Steem with the Wyckoff Method. It is really an interesting and knowledgeable contest. There is a lot to explore. If you want to join then:
Question 1: The Three Fundamental Laws of the Wyckoff Method
The Wyckoff Method is a set of principles and techniques. It was developed by the Richard D Wyckoff. He developed this method to predict the market behaviour by focusing on the price movements and volume analysis. This method proved to be very useful for trading the cryptocurrencies to predict their next movement by analysing the previous data of price movements and volume.
The Wyckoff Method has three fundamental laws:
- Law of supply and demand
- Law of cause and effect
- Law of effort vs result
The Law of Supply and Demand
The law of supply and demand is the foundation of all the market behaviour. This law implies to each cryptocurrency even to the whole crypto market. There are 2 cases related to this law of supply and demand.
Case-I: When the demand is increased than the supply then the prices rise.
Case-II: When the supply is increased than the demand then the prices fall.
Application to Steem
By analyzing the trading volume and the price action of Steem the traders can check the buying pressure for the steem token from its demand as well as the selling pressure from its supply. And they can guess which is dominating in the market whether the demand or supply.
For Example: If the price of Steem rises on the rise of the volume it shows the increasing demand and potential of Steem token. But alternatively if the price falls on high volume it shows that the supply is surpassing the demand and it can lead to fall in the price.
The Law of Cause and Effect
This law simply states that the cause will lead to an effect. In other words we can say every action has a reaction. Here the cause can be accumulation or distribution and an effect can be a uptrend or downtrend. The bigger the cause the bigger the effect.
Application to Steem
Before any significant price movement Steem can go through the cause. This cause can be accumulation or distribution. In the accumulation zone the strong hands accumulate the tokens. And if the accumulation is detected it can lead to the upcoming uptrend. On the other hand if the distribution is occurring it can indicate the upcoming downtrend.
Traders can use the volume and price analysis with other Wyckoff principles to assess whether the Seem is in accumulation zone or distribution zone. And in this way they can predict the future moves for Steem token.
The Law of Effort vs. Result
This Wyckoff law compares the effort with the results. Here we can say trading volume is an effort and price movement is a result. If there is a large effort in the volume with the minimum price movement then we can expect a potential reversal. But if the price moves strongly with the little effort then we can expect a strong trend.
Application to Steem
If the volume of the Steem does not increase significantly but the price rises it indicates the weak uptrend. And it also suggests that the reversal is near. Similarly if the price of Steem declines on high volume without the significant price drops it indicates that the Steem market is absorbing the selling pressure. It represents the reversal to an uptrend.
On the whole based on these 3 laws we can say:
The rise of Steem volume and price indicates the increased demand for the Steem. And conversely if the volume rises and the price drops it indicates the increase in the supply.
Accumulation and distribution zones lead to significant price movements. The accumulation of Steem represent the potential uptrend. And similarly distribution of steem indicates the potential downtrend.
Comparison between volume and price movement of Steem helps us to identify potential reversals or the continuation in the price trend of Steem.
Question 2: Cause and Effect in the Wyckoff Method
The Wyckoff method applies the principles of cause and effect to anticipate price movements. It predicts the price by suggesting that market events like accumulation or distribution are the causes and on the other hand price movements or the price trends are the effects. The greater the cause the greater the effect. By analyzing the size and duration of a cause in the market the traders can forecast the extent of the upcoming price moves.
1. Cause: Accumulation or Distribution
Accumulation: This is the zone when the institutions or the informed traders buy the assets while the price moves sideways. This is also known as the consolidation movements of the assets. This buying creates a cause for the eventual upward price movement.
Distribution: This is the opposite of accumulation. In this the informed traders start selling their assets without causing the large price drops. It ultimately leads to a downtrend movement.
Wyckoff suggested that larger and longer these phases of accumulation or distribution are the greater the effect on the price direction.
2. Effect: The Resulting Price Movement
When the cause (accumulation or distribution) is exited then the effect appears as the next movement of price (bullish or bearish) respectively.
Example
- After a long accumulation period a bullish price movement can occur.
- Similarly after distribution a bearish trend can occur.
Quantifying the Cause
In order to measure the quantity of the cause Wyckoff suggests us looking at these points:
Price Range: It is the size of the sideways trading range where the accumulation or distribution is happening.
Duration: It represents that how long the asset remains within that specific trading range.
Volume Analysis: The volume of the assets within that trading range reveals the accumulation or distribution.
Applying Cause and Effect to Steem’s Historical Price Data
I am assuming the Steem price in the history as an example.
Accumulation Phase
Here is the cause and effect of Steem's accumulation phase.
Steem Accumulation (Cause)
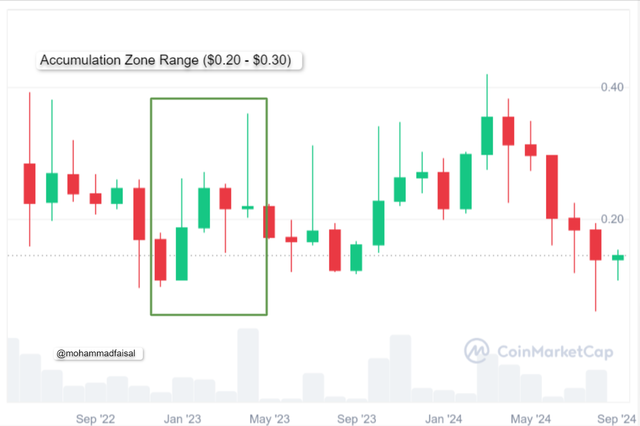
Let us suppose that between Januray 2023 and April 2023 steem price was ranging between $0.20 and $0.30. In this range the price of Steem moved in a tight range. The volatility decreased and volume went up. It was the indication that the institutional buyers were accumulating Steems.
The cause of that accumulation has time length of around 4 months and size of the price range was $0.20 - $0.30 which indicate a potential of demand.
Effect (Price Action)
After April 2023 which was the accumulation zone the price of Steem breaks out this previous range with strong price action and volume.
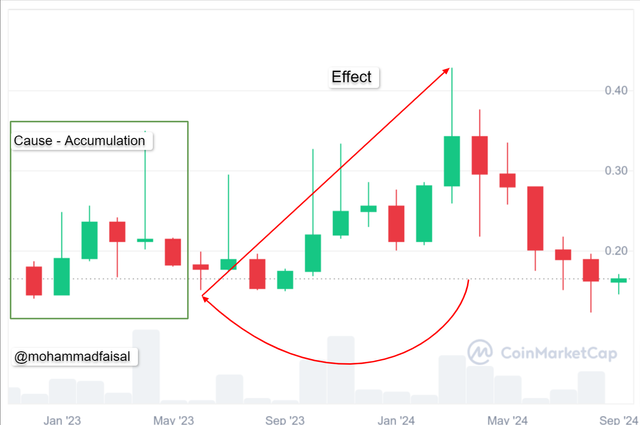
The previous accumulation zone led to an uptrend. The price rises more than $0.40 and an uptrend sustained there. Here we can guess that the larger accumulation zone or cause results in the larger price impact or effect.
So by using the Wyckoff method of cause and effect the traders can estimate the potential effect of the breakout by measuring the depth and width of the accumulation zone.
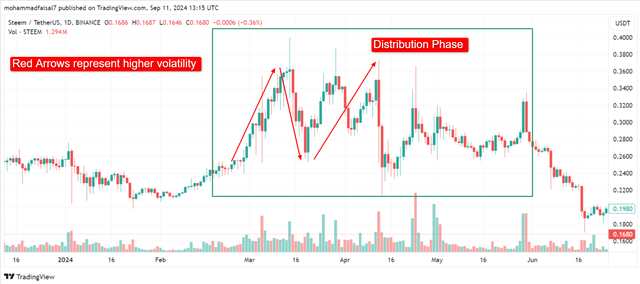
Distribution Phase
Here is the cause and effect of Steem's distribution phase.
Steem Distribution (Cause)
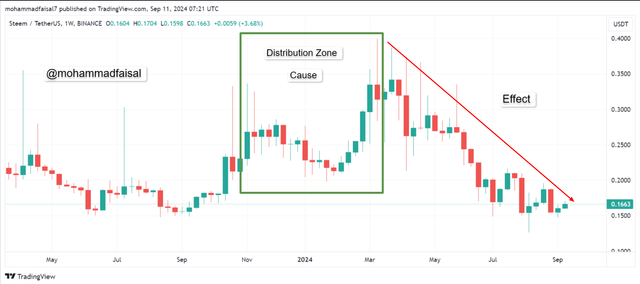
If we see the previous historical data of Steem price we can analyse that from November 2023 to April 2024, it is the distribution zone. In that distribution zone the string hands are distributing Steem to the retail investors. And the price ranged between $0.20+ to $ 0.40. The size of this distribution zone was 5 months. It was the cause in the fluctuation of the Steem price.
Effect (Price Action)
After the distribution zone we can see the effect of the cause significantly. The price breaks down from the distribution zone to less than $0.20. And Wyckoff method anticipate this downtrend based on the extent and the characteristics of the distribution zone.
So we can say that cause and effect principles of Wyckoff method helps us to the predict the next movement of the price based on the accumulation and distribution zone as we have concluded it for the Steem.
Question 3: The Law of Effort vs. Result
We can analyse the steem market by using the law of effort vs result by focusing the trading volume and the price movements of Steem token. This law tells us the relationship between the trading volume which is known as Effort and price movements which is known as the result.
There are two cases in this law of effort vs result:
Effort Exceeds Result: When the trading volume is high but the price movement is little or unchanged then it directs that the market is absorbing the effort. It suggests an upcoming reversal.
Result Exceeds Effort: When the price moves sharply on low volume it directs that market is moving with little effort. It suggests that the current trend is strong and it will continue ion the same direction.
Example of the Law of Effort vs. Result in Steem’s Market
Effort Exceeds Result (Potential Trend Reversal)
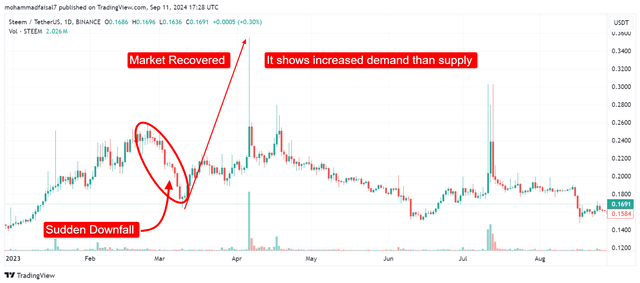
I am analyzing the Steem chart from 4th quarter of 2023. In the last quarter of 2023 the Steem price was in an uptrend. The price moved from approximately $0.15 to a significant level of around $0.30.
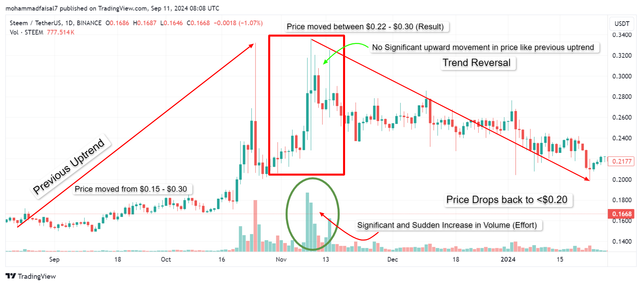
But one day suddenly the volume of Steem increased as an effort with little movement in the price. The price moved between $0.22 to $0.30 as a result. Here the case one was followed where the effort exceeds the result.
Analysis: We can analyze from this relationship of volume and price movements that the market was absorbing the buying pressure and the big investors or institutional investors were selling in that range.
Outcome: After several days of high volume and little price change the Steem market reversed and the price dropped back to less than $0.20.
Insight for traders: Traders can observe that when the volume increases without any significant upward movement in the price then it results in the exhaustion of the uptrend. And they can expect a short term top.
Result Exceeds Effort (Strong Momentum)
In February 2024 after the prior correction steem started rising upward again. The price moved from $0.20 to $0.25. Here the price moved upward with the little change in the volume. In this example the result exceeds the effort. And practically we can observe this in the below picture.
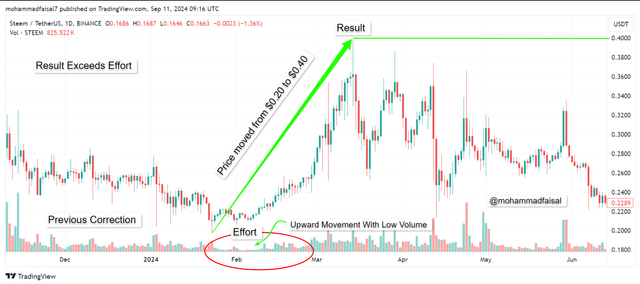
Analysis: We can analyze from this relationship of volume and price movement that the price moved up with low trading volume. This shows that the market is moving with little resistance. It indicates a bullish trend. Here the second case was followed where the result exceeded than the effort.
Outcome: It gave a strong bullish upward movement in the price of Steem. And the price continued to rise to approximately $0.40 as indicated in the picture.
Insight for traders: The traders can observe that when the price moves upward with low volume then they can expect an upward trend. It indicates a strong bullish trend and it is a good opportunity to ride the uptrend.
So by applying the law of effort vs result to the price movement of Steem the traders can identify the weak trends, market reversals or they can confirm the strength of a trend. When the effort is high than result then it suggests that current trend is loosing its momentum. Similarly when the result is higher than the effort then it suggests the current trend is strong.
Question 4: Key Phases of the Wyckoff Method
The Wyckoff method has four key phases. These phases represent different stages of a market cycle. These phases are:
- Accumulation
- Markup
- Distribution
- Markdown
These phases help traders to understand and predict the price movements and future trends. Each phase is crucial for predicting the price actions.
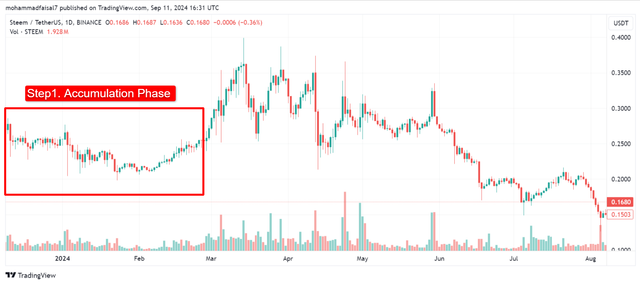
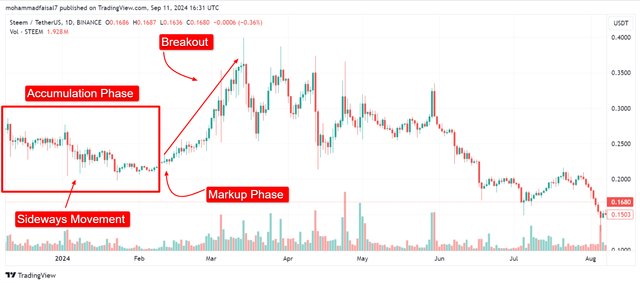
1. Accumulation Phase
This is the phase where the smart investors start accumulating the assets at low prices before a significant upward movement. In this phase the market moves sideways and the price has low volatility. Actually it is the preparation phase for the bullish trend.
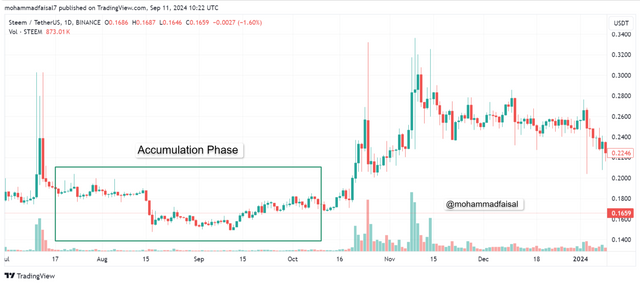
If we see the historical price data of Steem from mid of July 2024 to mid of October 2024 the price of the Steem is moving sideways. The volume of the Steem is changing sideways. As in the accumulation phase the volume increases on upward move and decreases on downward move. So in this range Steem is in accumulation phase.
How to Identify Accumulation:
- Spot long sideways price movements.
- Higher volume on upward move and lower volume on downward move
2. Markup Phase
This is the phase when the prices begins to rise after the accumulation phase. In this phase the investors drive the prices upward with strong buying pressure. And the retail investors also starts buying the assets which causes an ultimate bullish trend.
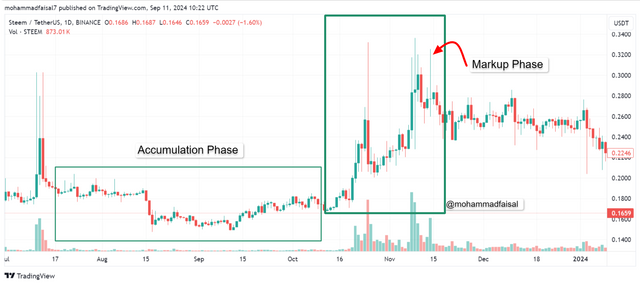
Here you can see that the accumulation period was of about 3 months. In the accumulation phase the smart investors accumulated the Steem tokens and the price moved sideways. And after mid of October markup phase started. And the price of Steem token began to rise upward.
How to Identify Markup:
- Breakout from the accumulation phase with strong price momentum.
- Higher highs and higher lows in price movement.
- Volume often increases when the price rises.
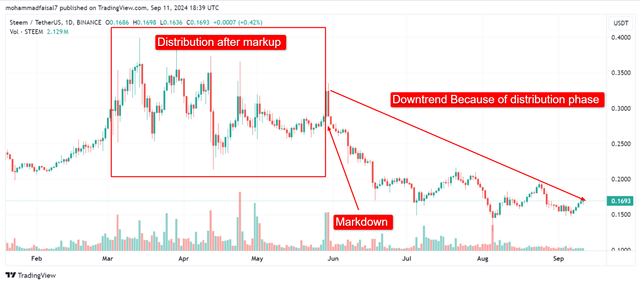
3. Distribution Phase
All the phases are linked to each other. After the markup phase distribution phase starts and the institutional investors start distributing or selling their assets at high prices to the retail investors. In this phase the price again moves sideways. But in this phase the price volatility is higher than the accumulation phase. It is the preparation for the bearish trend.
Here you can see that the distribution phase continued for around 4 months starting from the mid of February to June 2024. During the distribution phase the price of Steem moved between $0.25 to $0.40 with high volatility.
How to Identify Distribution
- Sideways price movement with large volatility and range.
- Higher volume during downtrend price movements
4. Markdown Phase
The markdown phase is linked with the distribution phase. After the distribution phase markdown phase starts. In the markdown phase the prices start falling down. In this phase the institutions and smart investors has already finished distributing their holdings. In this phase the retail investors stuck as they bought in the distribution phase which is almost at the top. And the price declines sharply leading to a bearish trend.
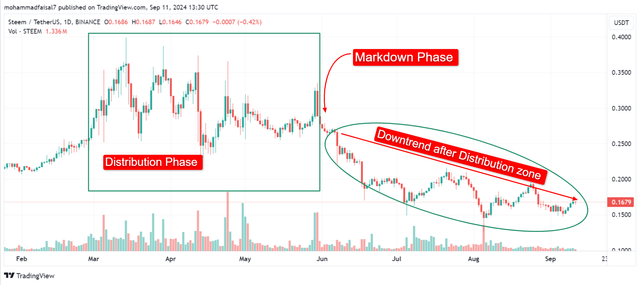
Here you can see that after the distribution phase the markdown phase started. The distribution phase ended with the price of around $0.28 and similarly distribution phase started from this and the price suddenly declined to $0.1687 and still it is down. And now after the this markdown phase the accumulation phase will start.
How to Identify Markdown:
- Breakout to the downside from the distribution phase.
- Lower highs and lower lows in price movements.
- Increased selling volume on price declines.
How to Identify the Current Phase of the Market
We can determine the current phase of the market using the Wyckoff method. In order to determine the current phase of the Steem market we can follow the following steps:
Detecting Sideways Movement: If the market is moving sideways then there are two cases for the sideways movement as we have already discussed these cases. But here I will again highlight them to understand for better decision making of the market phase.
Accumulation: If the price moves sideways with higher volume on the up days then we can guess it is most likely accumulation phase. We can start accumulating Steems for higher profit.
Distribution: Similarly if we see sideways price movement with higher volume on down days we can guess that phase is most likely distribution zone. In this phase we can make our trading secure while not participating in the buying of tokens.
Identification of Breakouts and Breakdowns: Again there are two cases one is breakouts and the other is breakdowns.
If the price breakouts above the trading range of the current market range then we can expect an upward rally in the Steem price. It indicates the markup phase is starting.
If the price of Steem breakdown below the trading range of current market then we can expect a downtrend. It suggests the markdown phase is starting.
Analyzing Price Structures: There are again 2 cases to analyze the price structure which are given below:
Carefully analyze that in the markup phase the price consistently makes higher highs and higher lows. We can see upward price movement with occasional pullbacks. And the general trend looks bullish. So if we see higher highs in the markup phase we can expect the strong bullish trend and we can take entry at the start of the markup phase.
If we see that the markdown phase the price consistently makes lower highs as well as lower lows then it indicates a clear downtrend. In this zone sellers become dominate. So in such price structure do not take an entry in the buying to keep yourself from the selling pressure.
So by keeping in view the above important points according to Wyckoff method we can identify the current phase and the trend of the market.
Question 5: Applying the Wyckoff Method
Here is a step by step guide to apply the Wyckoff method in trading Steem tokens. I will focus on identifying the accumulation phase, testing supply and demand and then recognizing the markup phase.
Step 1: Identify the Accumulation Phase
Accumulation phase occurs when the institutional traders silently buy Steem tokens without the significant move in the price. In this phase the price moves sideways in the resistance and support level.
Identifying Accumulation Phase
We can identify accumulation phase by following these things:
Sideways Price Action: In the accumulation phase the price moves sideways in between the resistance and support level.
Volume Behaviour: Volume increases with an upward movement in price.
Price Range: The range of the price remains within the defined support and resistance level.
In the above accumulation zone of Steem token the price is moving in between the $0.20 and $0.27. This range is forming a horizontal trading range. In this range the volume also remain in a specific range and the price did not break lower level.
Step 2: Test for Supply and Demand
After the accumulation phase the markup phases starts and before the start of the markup phase the institutions tests the supply and demand of the tokens. It is essential to check if the market can handle the breakout without facing significant selling pressure.
Signs of Supply/Demand Tests:
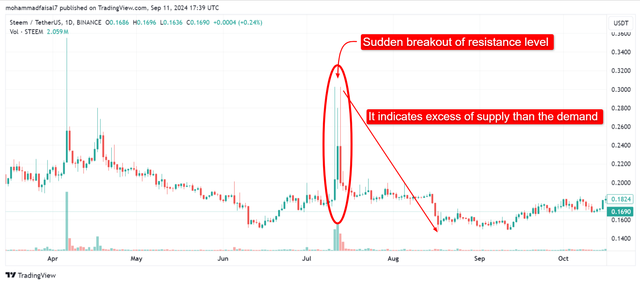
- When the price dips below the support level the retail traders become panic and they start selling their assets. If the price recovers quickly and start trading in the higher range then it indicates the demand of the assets. And the breakout proves to be a false movement and the buyers absorb the supply while buying the tokens. In this movement the weak hands are shaken out and they leave the trades but the smart traders accumulate more assets.
- But when the price breakout above the resistance level and suddenly falls below the resistance level so it becomes fail to stay above the resistance level. It test helps to confirm the excess supply of the tokens in the market. Due to the excess supply and low demand the price falls down the higher range and starts trading in the lower range.
Step 3: Recognize the Transition to the Markup Phase
When the accumulation phase is completed and the supply or demand tests are successful then the price starts its breakout from the current range. And it leads to the start of the markup phase. This is the phase where the institutional buyers or whales push the prices higher and further the retail buyers join the buying pressure which further impacts the price to move upward.
Identifying Markup Phase
We can identify accumulation phase by following these things:
Breakout above resistance: We can identify the markup phase by tracking a clean breakout of the price above the resistance level.
Increase in Volume: The increase in the volume while upward movement also confirms that the buyers are driving the prices higher hence the markup phase.
Higher highs and higher lows: The price starts its upward rally and makes the higher highs and higher lows.
Here you can see that the markup phase has been identified successfully after the accumulation phase. The price broke out from the resistance and uptrend started. It is how a markup phase works after the accumulation phase. The price broke out from $ 0.21+ and it touch $0.39+ in the markup phase. And a trader who is applying the Wyckoff method can take this as a buy signal and can enter the market at this point.
Step 4: Monitor for Distribution
As the markup phase continues to move forward eventually a point occur where the institutions start distributing their holdings to the retail investors at higher prices. It is opposite to the accumulation phase.
Identifying Distribution Phase
We can identify accumulation phase by following these things:
Sideways price movement with high volatility: If the price moves sideways but with higher fluctuations towards higher and lower levels then it is the distribution phase.
Lower highs: If the price tries to go upward but fails to reach the new highs then it the distribution phase.
High volume on down days: If the volume is increasing but the price is going low then it suggests that the selling pressure is increasing because of the distribution of the assets by the strong hands to the weak hands. It is the distribution phase.
It is the recent price data of Steem where the distribution zone started after the markup. Distribution phase started from March 2024 and it remained until May 2024. And we can see that after the distribution phase the markdown phase started eventually and it set the price to move downward. And still price is moving downward.
So from the Steem recent price data chart the markdown is the sign to exit the market without loosing your profit. The trader following the Wyckoff method could surely exit its entry before the start of the markdown by seeing the increasing volume but higher volatility of the price with the increasing supply of the assets.
Conclusion
Wyckoff method helps the traders to anticipate the different phases of the market. We can use the Wyckoff method for trading Steem successfully. It helps us to identify the accumulation, distribution, markup and markdown phases of the market. We can guess the upcoming trend and exhaustion of the current trend by analyzing of the law of supply and demand of Wyckoff method. And by monitoring the distribution phase helps the traders exit before the markdown phase to avoid losses.
Disclaimer: All the screenshots used are taken from Coinmarketcap and Tradingview. The name of the platform is printed on each screenshot as their markdown.
@mohammadfaisal
Upvoted! Thank you for supporting witness @jswit.
X Promotion: https://x.com/stylishtiger3/status/1833951764502249774
This was a really good, in-depth breakdown!
This post has been upvoted/supported by Team 7 via @httr4life. Our team supports content that adds to the community.
Thank you team 7 and especially @httr4life for support. Highly appreciated.
@mohammadfaisal Your post provides a thorough and insightful explanation of the Wyckoff Method and how it applies to trading cryptocurrencies like Steem. I appreciated how you have broken down the three fundamental laws and their relevance to understanding market behavior Especially with clear examples of accumulation and distribution phases. The detailed analysis of price movements and volume make it easier for trader to grasp potential trends. This information is definitely helpful for anyone looking to refine their trading strategies.
Good luck with the contest!
Yes indeed the accumulation and distribution phases provide information of potential trends to the traders.
Thanks for stopping by here and leaving your valuable feedback.
The Wyckoff Method is one of the trading tactics which focuses on cycle analysis through supply-demand concepts. It consists of four key phases. namely, accumulation, markup, distribution and markdown. These phases can be recognized by traders based on the price action and volume patterns, so that trader can have the right entry and exit points in the Steem token market. Your explanation was awesome specially supply demand and accumulation all the best my dear friend.
Yes it consists of 4 phases and a trader can utilise this method to take entry and exit entry and can predict the next phase and trend.