Repost :Technical Indicator - Crypto Academy / S4W2 - Homework Post for Professor @reminiscence01.
1

a) In your own words, explain Technical indicators and why it is a good technical analysis tool.
WHAT ARE TECHNICALLY INDICATORS?
Technical indicators are analysis tools used by traders to analyse and forecast future price movement of an instrument in the global financial market.
Technical indicators are gotten through mathematical calculations based on an asset's past data, like price, volume or open interest. Technical indicators tools make use of these past historical records of an asset to predict it's possible future price.
This concept is based largely on the belief that past history of a tradable instrument tends to repeat itself over time. The possibility of this notion lies on different market psychologies forming at every given point in time leading to market circles.

Take for example, in traditional markets, every festive period the demand for grains and cereal foods tends to increase and these affects the price. This circle is predictable because festive periods are all about festivities. People buy more eatable items. During festive period the volume of supply will be high and at the same time the volume of demand. (swing high and swing low) While it may be uncertain to determine that the volume by which people bought grain the past year may be equal, lesser, or greater than the present or the future year, yet there is this certainty that within festive period, demand for grain most increase. Past volume records offers vital information regarding the growth of demand over time.
From the above example, will indicators be needful? The answer is a big yes. Although the market may seem predictable the volume overtime needs to be analysed. The pace at which price changes due to demand in the previous years may be considered. The strength of the sell and the strength of the buy. For traders to make the most of the profit, they need to know when to buy and when to sell. This is similar to what happens in the global market.
In application, What technical indicator does is to help a trader figure out market movements to enable him make a trading decision.
During periods of high demand and supply, when an asset has high buys and high sells, we say that the asset is trending.
At other times, the movement of the market may be choppy or moving sideways, at this time the market is said to be in range
Technical Indicators are good analysis tools because of it's benefits to the traders.
Take for example. A trend following indicator can inform a trader at which trend the tradable asset price is. Is it a bullish trend ( going upwards) that is when buyers of an asset is more than sellers or a bearish trend (going downward) that is when sellers are dominating the market? With the information, a trader has a clearer view of the market rather than trading blindly.
Another example of technical indicator benefits is that of momentum indicators which helps a trader recognize turning points in a price movement of an asset. A trader can decide on entry and exit positions using these indicators.
In all, the beauty of technical indicators is that it aides a trader reach decisions which ordinarily he might do otherwise when trading without indicators. A trader can spot reversal points, recognize trend, identify entry and exit points etc.
b) Are technical indicators good for cryptocurrency analysis? Explain your answer.
The answer is an emphatic yes.
Cryptocurrencies are tradable assets. Technical Indicators works for any tradable instrument in the global market.
The volatile nature of cryptocurrencies is a compelling reason why cryptocurrencies needs indicators. In the crypto market huge changes in price can occur within shortest periods even minutes or seconds. For example, Using indicators that can spot out the pace at which price moves may present an advantage for a day trader. Other indicators which can spot out reversals, trend and trend strength are equally necessary for for day traders.
A trader trading HODL can equally take advantage of an indicator to trade cryptocurrencies. Take for instance, an indicator can help the trader identify an assets overbought or oversold positions.
Several use cases shows the profitability of
trading cryptocurrencies with technical indicators.
Usually, when analyzing cryptocurrencies, aside from fundamental analysis, other things a trader considers would be liquidity, the volume at which the crypto rises or falls, the pace at which the price of the asset moves, it's overbought or oversold positions etc; all these can be determined using indicators.
c) Illustrate how to add indicators on the chart and also how to configure them. (Screenshot needed).
In this exercise I will show how to add Bollinger bands indicator to a chart. I will do that using tradingview.com.
Step 1
Once at the tradingview chart page, go to indicator button. It is seen at the top layer of the chart template. Click on it as shown in the image below.
Step 2
Add the indicator by going to built-in, then scroll down to choose from indicator list or type the name of the indicator in the indicator search box and select.
Step 3
Click on the indicator and it will Simply appear. See details on image below.
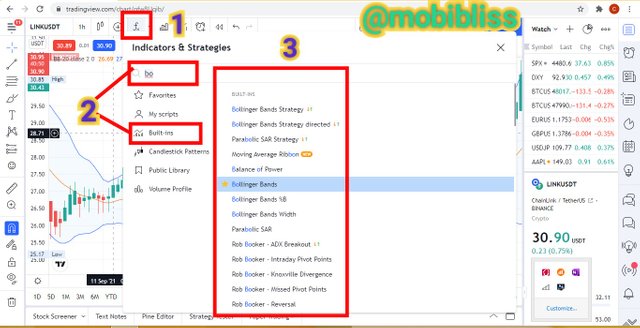
Steps on how to add indicator. Tradingview.com.
•••
HOW TO CONFIGURE INDICATOR.
with our added indicator, we need to ensure that the parameters are correct, otherwise we should set to our desired parameters.
- Goto the indicator settings as shown below.
Chose style to change to desired colour of the lines of the Bollinger bands. Select any colour of choice for any of the bands.
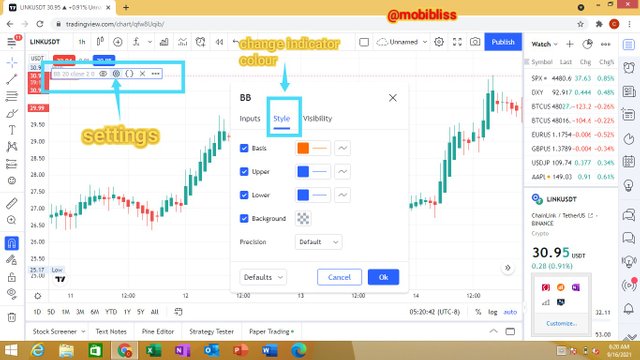
How to configure indicator. Setting up desired colour on Bollinger bands indicator. Tradingview.com.
•••
- Next. Goto inputs. Confirm or configure the parameters. For Bollinger bands the standard parameter is the period of 20.
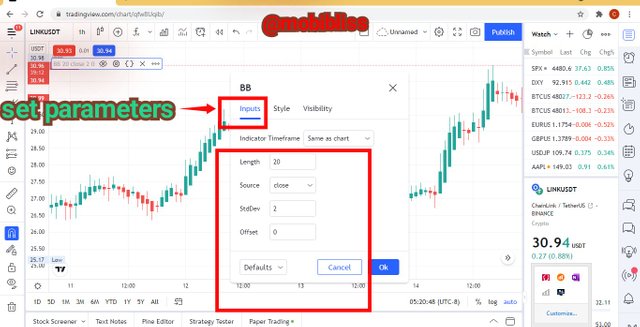
from the inputs, set parameters, configure desired configuration. In this case I used default values.
•••
- Next. Goto visibilities. Set to default.
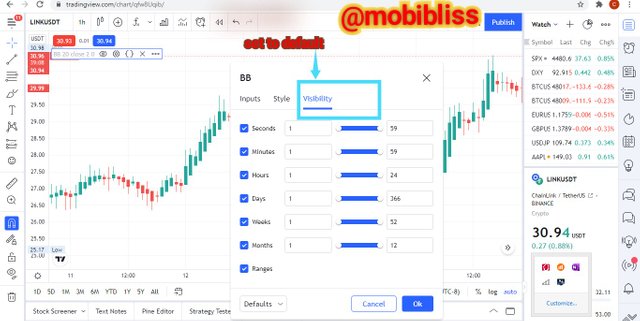
Setting up indicators, tradingview.com
Now the indicator is ready.
2
a) Explain the different categories of Technical indicators and give an example of each category. Also, show the indicators used as an example on your chart. (Screenshot needed).
There are four categories of technical indicators. Below are the list.
1: MOMENTUM INDICATORS.
These indicators are also known as oscillators. They are used to identify trends and can be used to measure the pace at which the price of an asset moves by considering the assets previous "closes".
An example of a momentum indicator is the relative strength index RSI. This indicator is used to determine trend and the magnitude at which price of an asset changes by measuring it's overbought and oversold positions.
RSI has a bounded line of 1-100. An asset price is considered oversold when RSI indicator reads 30 or below. An asset price is considered overbought when RSI reading passes 70.
markets oversold or overbought positions presents an opportunity for traders to enter positions.
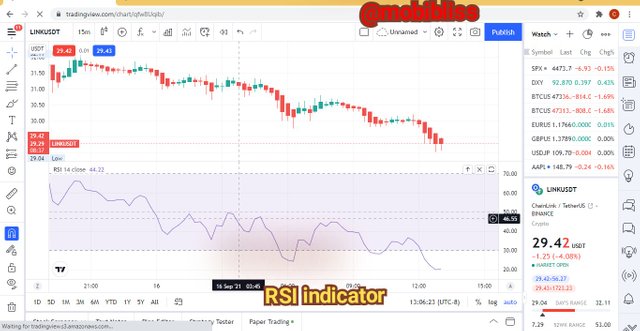
RSI indicator. tradingview.com
•••
2: TREND INDICATORS.
These indicators are used to measure the direction of trend of an asset and also used to determine trend strength.
An example of a trend indicator is the parabolic sar indicator. This indicator follows the price direction of an asset. Parabolic sar can be seen on a chart as a doted line above or below a price movement. It uses a method known as the pause and reverse. When there are changes in the movement of the price of an asset, the indicator pauses and flip to the opposite side.
When the doted line of the parabolic sar is above the price chart, it indicates downtrend, conversely, when the doted line of the parabolic sar is below the price chart it indicates uptrend.
With indicators like parabolic sar, traders can spot reversals.
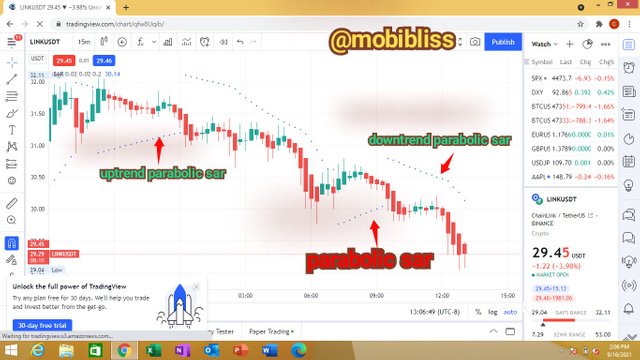
Parabolic sar. Tradingview.com
•••
3: VOLUME INDICATORS.
Volume indicators are used as confirmation tools. It helps a trader confirm trend continuity and spot out reversal points.
Take for example, if an asset's price volume increase when the asset price movement is on a bullish trend, it means that there are more interest shown in the market by new buyers
Conversely, if an asset price decrease in volume when an asset is in a downtrend, it means trend continuity.
An example of a volume indicator is the volume RSI. Volume RSI is similar to RSI indicator but the difference lies in the calculations. While RSI uses price changes to get it's calculations, volume RSI uses volume-up and volume-down.
The indicator has same measurement range of 0 -100. It oscilates around a central point 50.
- When the reading of the indicator is above 50, it is considered an uptrend and a trader can trade buy.
- When the reading of the indicator is below 50, it is considered a downtrend and a user can trade sell.
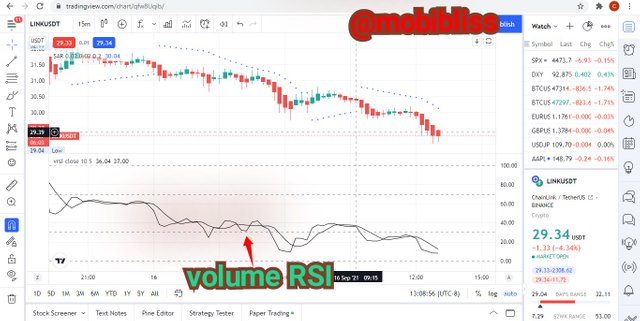
volume RSI. Tradingview.com
•••
4: VOLATILITY INDICATOR.
Volatility indicators are used to measure swing highs and swing lows of an instrument. It is used to determine changes of market movements over a period of time. When changes within the period are high, it means higher volatility and when the changes are low, it means lower volatility.
The volatility of an asset can provide good trading opportunities.
An example of a volatility indicator is Bollinger bands. Bollinger band has 3 bands, the middle one is usually a period of 20, the upper band is plus two deviation of the middle band, the lower band is -2 deviation of the middle band.
When the price chart touches or crosses the upper band, it means that the asset is in it's overbought position and a reversal maybe be soon.
Conversely when the price chart touches the lower band, it means that the asset is in it's oversold position and a reversal might be imminent.
When the market is trending, the bands of the Bollinger bands expand. When the market is ranging, the bands shrinks.
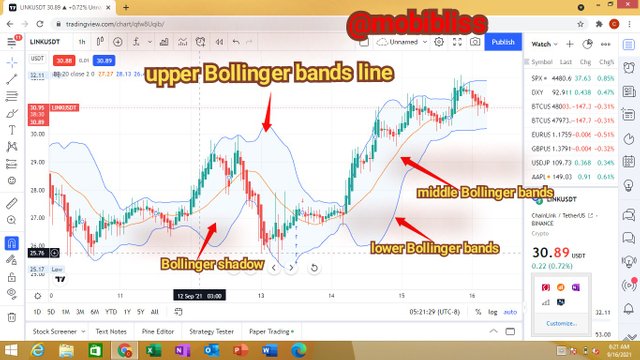
Bollinger bands. tradingview.com.
•••
Traders can enter buy or sell within these oversold or overbought reversal areas.
b) Briefly explain the reason why indicators are not advisable to be used as a standalone tool for technical analysis.
No indicator has a 100 percent accuracy in predicting markets, that is why using one indicator in analysis may not be ideal.
c) Explain how an investor can increase the success rate of a technical indicator signal.
A trader can do this by combining two or more indicators. While one indicator serves as a signal provider the other indicator can be for signal confirmation. Combining two or more indicators has resulted to profitability in the forest and crypto markets.
Another way is by comparing the indicator over different time frames. Some indicators may work for longer time frames while others may work better for shorter time frames. Comparing the indicator over varying timeframes may help us identify the best indicator to use and at which time frame it works better.
Let me at this point demonstrate using two indicators the Bollinger bands and the RSI. while the Bollinger bands will give the signal the RSI will confirm the signal of the Bollinger bands.
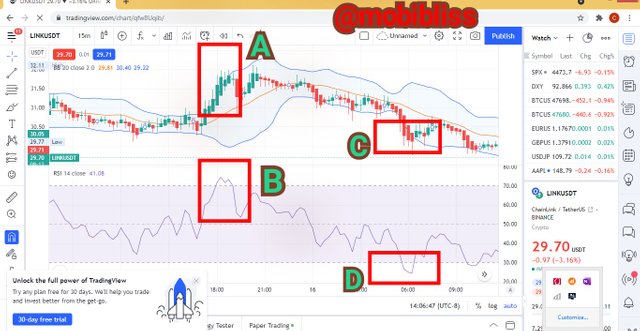
Bollinger bands, RSI. Linkusdt chart. Tradingview.com.
•••
In the linkusdt chart above, I have added two indicators, Bollinger bands and RSI.
At point A, a breakout in the upper Bollinger signals overbought position. We saw it confirmed at point B. RSI indicator has crossed the 70% line showing overbought. At this point a trader can trade``sell.
At point C we saw Bollinger broke support at it's lower line signaling oversold position. We can see the confirmation at point D,RSI reading was below 30% line. A trader should enter buy
Bottom line
Combining two indicators like this has benefits. It can help to reduce false signals. Secondly, it gives added confirmation to our signals giving a trader further confidence over the analysis.
CONCLUSION.
Technical Indicators are the idea of using past historical record to predict future price of an asset.
Indicators falls into different categories and these indicators has varying functions.
Combining more than one indicator results to optimum benefits in trading.
Indicators can make a trader become more skilled and therefore profitable.
Hello professor @reminiscence01, I have reposted the work. done it.
Please edit your title using this format.
Repost: Technical Indicator - Crypto Academy / S4W2 - Homework Post for Professor @reminiscence01.
Thank you sir, @reminiscence01, I have done it.