Bitcoin Back Above $10K But Gains Could Be Short-Lived

Bitcoin is back above $ 10,000, but its rise could be short-lived, the price chart shows.
After breaking the key support yesterday, the price of CoinDesk's Bitcoin Price Index (BPI) fell to a two-week low at $ 9,627.89 at 01:14 UTC today. In the last few hours, bitcoin (BTC) managed to regain some peace and move back above $ 10,000. At the time of writing, bitcoin is around the $ 10,300 mark.
A 15 percent decline from weekend highs at $ 11,942.25 signaled the continuation of the lowest price series in the price graph, suggesting that the bear remains under control.
That said, a quick rebound from $ 9,627.89 to $ 10,000 adds to the belief in the argument that crypto could form a base of about $ 10,000.
However, a 4.9 percent rally from an intraday low of $ 9,627 looks like a technical correction amid a bigger downtrend. Furthermore, a break below $ 9,780 could lead to sharp losses.
Bitcoin chart
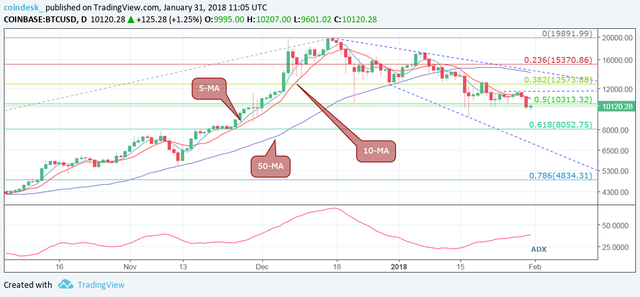
The above chart (price according to Coinbase) shows:
BTC closed (as of UTC) yesterday below $ 10,313 (50 percent Fibonacci retracement 2017 low), signaling another win for the bear. However, they have failed at least four times in the last two weeks to keep prices below key Fibonacci levels, thus setting it as an important support level.
The falling channel is indicated by the decreasing trendlines representing the lower high and lower low.
The five-day moving average (MA) and the 10-day moving average are likely to decline, indicating a bearish move.
The 50 day MA has adopted a bearish bias (starting down).
Also, bearish movement below $ 10,313 witnessed yesterday looks strong.
4-hour chart
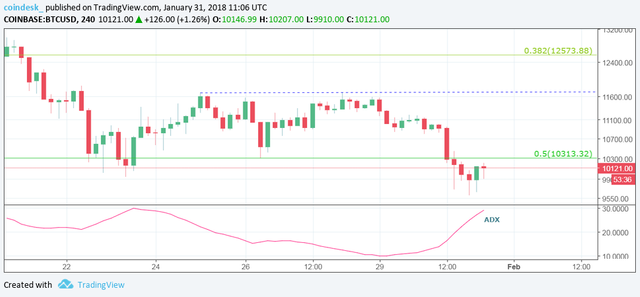
The ADX line bottomed out yesterday and rose sharply once prices fell below $10,313, indicating the bearish move is strong and prices will likely extend the decline.
Currently, the ADX line is at 29 and rising. The above 25 readings indicate the beginning of a trend. In BTC' case, it means the bearish move has likely just begun.
So, the cryptocurrency looks set to test $8,052 (61.8 percent Fibonacci retracement of 2017 low - high) over the next few days.
However, the above scenario may not come to fruition if the rising trendline continues to cap downside in bitcoin.
Trendline chart
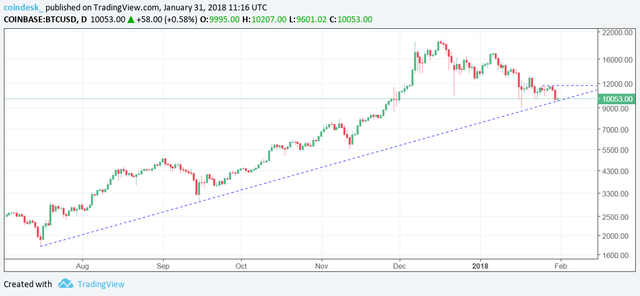
The ascending trendline (drawn from Jul. 16 low and Sep. 15 low) is still intact. BTC's dip below the trendline seen earlier today was short-lived.
Look
The previous day closed below $ 10,313 (Fibonacci retracement of 50 percent 2017 low-high) has strengthened the bear.
However, a rebound of trendline support seen today is calling for caution.
A daily close (per UTC) below the trendline support of $ 9,780 could result in a decline to $ 8,052 (61.8% Fibonacci retracement 2017 low to high).
Bullish scenario: Daily close (as of UTC) above $ 11,690 will change the table by bullish.