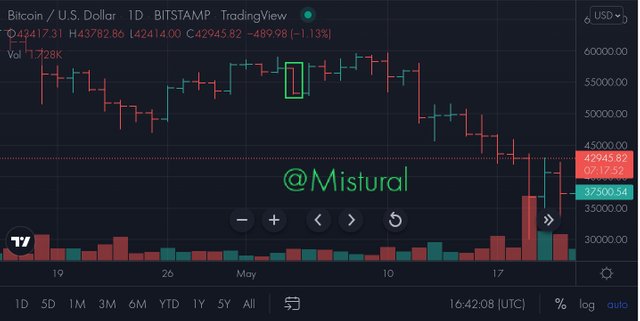
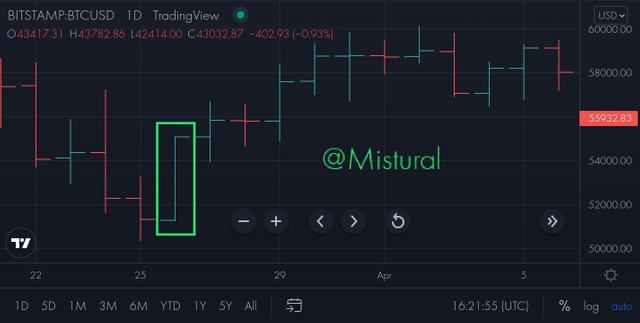
STEEMIT CRYPTO ACADEMY S6-W8:: HOMEWORK POST ON READING SPECIAL BAR COMBINATION::
SEASON GREETINGS EVERYONE
I will like to use this opportunity to say a happy new year to everyone. May God continue to keep us and our entire family in love and unity.
A heartfelt thank you to God the creator for the opportunity He has given to us all and the liberty to be alive and sound. All thanks to Him for his hood work in out live and that of our family.
So I will also say a big thank you and a work well done to prof. @sachin08 for this wonderful lesson. And also comment on the wonderful work and coordination put up by the academy to see that we are all in order and good shape. I say a big that you.
INTRODUCTION
In the previous lectures held by Prof. @sachin08 you will agree with me that we had being able to learn about Trading majorly, which implies; Recognizing patterns in Trading which may include; Flags, Triangles, Rectangles including Wedges.
It is therefore very nice to finally being taught about PRICE BARS. This is therefore the topic for this week.
.png)
Explain Price Bars in your own words. How to add these price bars on Chart with proper screenshots?
A price bar can simply be said to mean the building block of technical analysis. This can therefore be defined as the price action of any given crypto asset or security over a given period.
It will interest you to know that the analysis of a price bar simply enable traders or investors to know the particular trend of the market over a trading period.
A Price Bar simply Portrays the presence of High, Low, Close and Open that are present in the over a trading period of an asset.
Furthermore, the price bar can be of colors which are Green or white to indicate when there is an increase in the price action of the asset while Red or Black simply stands to represent the fall of price of that particular traded asset.

Components of the Price Bar
The price bar comprises of four (4) key components as earlier stated which include:
- Open
- Close
- High
- Low
Open: Price at which the underlying traded asset/token opens for trading.
Close:The end-of-day price of the underlying stock traded asset/token.
High: The intra-day maximum price of the underlying traded asset/token.
Low: The intra-day low price of the underlying traded asset/token.

HOW TO ADD PRICE BARS ON CHARTS
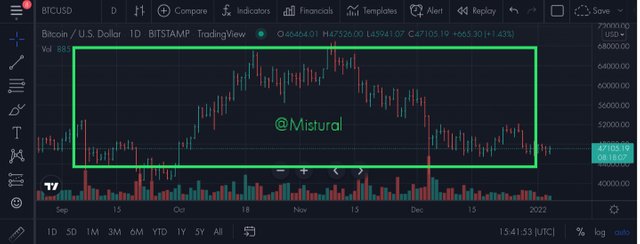
In performing this exercise I will be using @Tradingview site to perform this. As shown below.
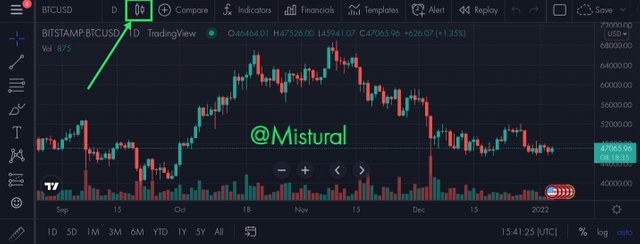
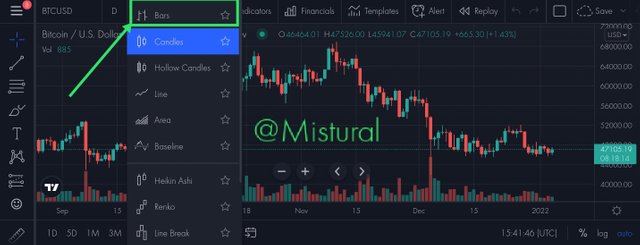
.png)
How to identify trends using Price Bars. Explain for both trend. (Screenshots required)
The identification of trends using price bars is quite simple through the understanding of some basic concepts.
But before going to talk about this few concepts I will like to identify the common available types of trend which are basically two (2).
Bullish Trend/Up Trend: This is a type of trend that simply indicates the rise in price of a particular traded asset. This simply indicates when an assets price is high. It is indicate the rice in the market price of an asset/token.
Bearish/Down Trend: This simply indicates the downward movement of the price movement of an asset. This simply shows that the price of a crypto asset is undergoing a downtrend or market dip.
As earlier said, there are basic concepts which will help to the identification of trends using price bar charts.
These concepts simply include;
- Higher High.
- Higher Low
- Lower High
- Lower Low
Higher High: When the present high of the traded asset/token is higher than the previous high, then it is known as Higher high.
Higher Low: When the present low of the traded asset/token is higher than the previous low, then it can be known as Higher low.
Lower High: When the present high of the traded token/asset is lower than the previous high, then it can be known as Lower high.
Lower Low: When the present low in the traded token/asset is lower than the previous low, then it can be known as Lower low.

IDENTIFYING AN UP-TREND/BULLISH TREND
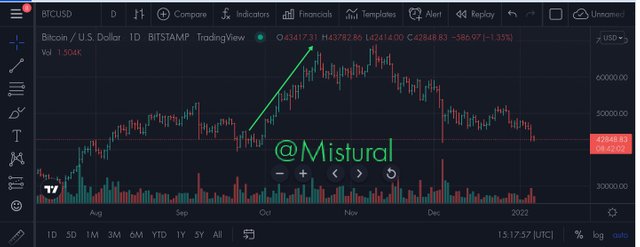
In the identification of a Bullish trend, it is basically based on observation which involves the presence of a higher high.
To identify an up trend in a market price of the asset, we have to look at the chart and when we notice that the higher highs of the present high is higher than the previous high of the previous day.
This is simply shown in the chart below.

IDENTIFYING A DOWN TREND/ A BEARISH TREND
Similarly to the indemnification of a bullish trend, based on observations.
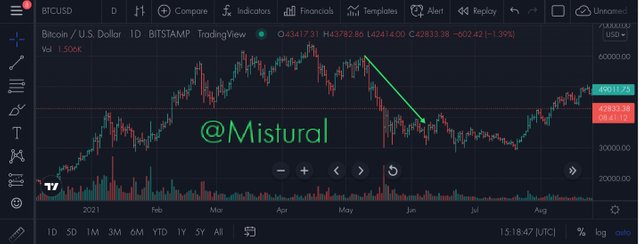
A downtrend simply comprises of a sequel of down bars.
Hence, the identification of a down trend, can be identified through the sequel formation of downward moving bars that are the present low is lower than previous low. This is shown in the chart below.
.png)
Explain the Bar Combinations for Spending the Day inside for both conditions. (Screenshots required)
Through the understanding of various Bars combination, this can simply aid the understanding and also interpretation of what the price of the traded asset is to be next.
Also, a clear understanding of the various types or form of this Bar's simply enhances gold decision making for the trader.
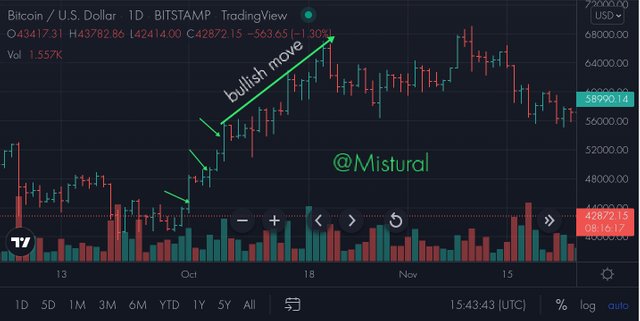
In a nutshell, the understanding this various Bar combinations simply Aid the trader for proper prediction of the next/upcoming price on the traded token. This is further demonstrated through the charts below.
From bullish chart above, you will notice that the trend of the market is simply and up Trend which signifies bullish movement.
The price of the asset, through several Bar combinations simply closes at the high over the previous highs. Several highs formation, this simply indicates that there is a formation of an up trend.

Spending the Day Inside

In a more simple term, what is meant by an inside day are simply thee sequel Price Bar combinations which meets two criteria, Namely;
- The High is lower than the previous day's high. In the traded token. This on the other hand simply indicates trend continuation.
Which is simply the successive combination of bars of higher highs and higher lows.
- The Low is higher than the previous day's low in the traded token.
Once this criteria are met, it therefore stands for what is called an Inside day.
Furthermore, I will say that, an inside day is also referred to a Price Bar which is 'Inside' the previous day's High-Low Range.
The inside day in a price market of an asset simply indicates or serves as a warning to the traders/investors that the market is starting to reconsider what it feels towards the traded token. Or can it simply indicates that the strength of that particular trend ha weakening and there might be change soon.
Hence, this operates a state of in-decision.
.png)
Explain the Bar Combinations for Getting outside for the Day for both conditions. (Screenshots required)
The Out Side Bar strategy is a comparison of the bar's high and low values with those of the previous bar.
When the current high is higher than the previous one and the current low is lower than the previous one in the traded asset, the strategy will enter a position (Either Sell Or Buy).
This means the recent bar can fit the previous one 'inside' it. Furthermore, the direction of the bar simply depends on the bar itself if the bar is green (which indicates bullish trend/rise in price of the traded asset, it will enter long. On the order hand, if the bar is a red bar (Bearish trend/dip in price of the traded asset), it will enter a short position.
As earlier said, based on the open or close position formed either by the green or res bar, simply Indicates a reversal in the trend of the traded asset.
This is further demonstrated in the price chart below.
.png)
Explain the Bar Combinations for Finding the close at the open for both conditions in each trend. (Screenshots required)
Once a close at the top is been identified in a price chart of a traded token, this simply points out that there is going qto be a reversal to occur soon. This is therefore demonstrates by the Chart Below.
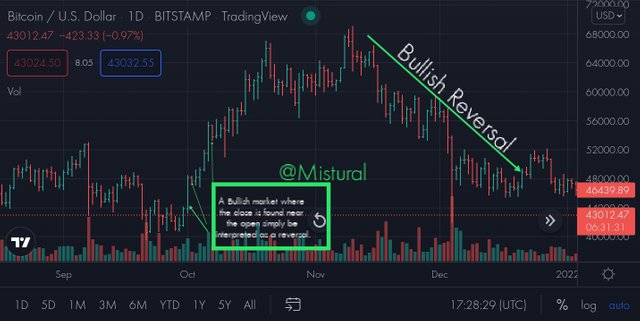
In a a clearly stated manner, from the observation of a price bar chart, after first if all identifying the trend to either be Bullish or Bearish trend, major attention is needed to observe that ticks of either that close or open. This is done in order to Identify/predict the nature of the market to be either a Reversal or a Trend Continuation.
Therefore, when both the open and close are near the high (for Up Trend) this Implies that there will be Reversal of the trend downhared.
Similarly, for a Down Trend when both the open and close are near the low this then implies that there will be a continuation in down Trend.
.png)
CONCLUSION.png)
As a result of this lesson, I have being able to learn about understanding and being able to Read Special Bar Combinations. There are numerous endless bar combinations there are present on the chart and the ability of a trader or and Investor to be able to identify these bar combinations, it will therefore be extremely helpful and beneficial for them.
I will therefore say a very big thank You to God for helping me through this assignment and to you all for reading my work.
A big thank you to prof. @sachin08 for his wonderful work.
NOTE: All images/screeenshot used where edited by me from tradingview and @canvas
CC:@sachin08
CC:@steemitblog
.png)
