Repost || Trading Using Wedges Pattern - Steemit Crypto Academy - S5W5 - Homework Post for @sachin08


Introduction

Good day, everyone! I'd like to welcome you all back to another exciting week at the Crypto Academy.
We're back in week 5 of the fifth season, and it's been a wonderful ride thus far. On today's topic, I'll be discussing one of the best trading methods, "Trading Using Wedge Pattern," which was tutored by professor @sachin08, and you can join me and learn from the post.
Stay tuned for my participation to the assignment, and I wish you a pleasant reading experience!!
1. Explain Wedge Pattern in your own word.

Wedge patterns are a classification of candlestick patterns that are used in technical research to measure the power of price movement in the stock market. Candlestick patterns were introduced first by Steve Nison in Western World and it was used by the Japanese for rice trading by the traders and to fix the price movement in the commodity market.
Meaning Of Wedge Pattern
It is a price pattern that is marked by merged trend lines on a price chart. And it is always measured by two trend lines to connect the various increases and decreases of a price series around 10 - 50 course of the periods, and the lines represent that if the increases and decreases are rising or falling and different rates, giving the look of a wedge as the lines approach a convergence.

source
Furthermore, wedge pattern is said to be a form of price of a security that when the support trend-line and the refusal (resistance) trend-line are been converged.
A wedge emerges when two lines are connected to the sequential increases and decreases of security in the time that a trading time is tended to be converged.
Wedge patterns are usually formed at the top/bottom of a trend. It requests trading to be done when the straight lines are converging together. Either when the time of pattern is been arranged. And it could be taken to anywhere in a few weeks to 7 months for it to completely become a wedge, this patterns always have an upward trendline and a downward trendline that involves the same points. A real point of leaving between wedge patterns and triangle patterns, which also have a pair of trendlines, and is that in the old category both lines are besides upward and downward sloping. Moreover, they are only one line that is upward or downward sloping that involves the triangle patterns.
2. Explain both types of Wedges and How to identify them in detail. (Screenshots required)
Wedge pattern can notify either the Bullish and the Bearish price cancellation or reversal, it’s held on three characteristics, Converging, Declining volume as the price moves through the pattern, and Breakout trend-line from one to another.
The main two forms/types in which wedge patterns are raised, which include; The Falling Wedge and The Rising Wedge
- Types of Wedges
Based on the forming of the straight lines to support all the trend-lines, the two types of a wedge are:
Rising wedge
Falling wedge
Rising Wedge: It usually happens when a security price already has been placed on overtime rising and can still happen amid a downward trend too. It is set up connecting between the trendlines, it is always seen as an upward price that is leaped by the two bisect and up sloping trendlines as well.
It is also seen as a bearish chart pattern that the trend-lines slant up that is said to be after the arrangement of a rising wedge, the price will move in a downward way after some breakout. It is also said when a rising wedge is merged after an uptrend, they always come a turnaround in the price movement that is usually a bearish turnaround which indicates a downtrend of the asset price.

- How To Identify The Rising Wedge
Well in this section of task I'll be making a table that consist of the characteristics and the review of the rising wedges;
| Characteristic | Reviews |
|---|---|
| Breakout Volume | It is can be always big or small and is always below the average |
| Two up-sloping trend – lines | It is seen in two lines, one is at the small increases and one at the small decreases. And but are slant upward way and cut into two. |
| Volume Trend | It is essentially trending downward in the agreement of the rising wedge |
| Multiple touches | It must have different touches on both trendlines. This implies that the trendlines that are formed usually touch both ends of the two-up slipping lines. |
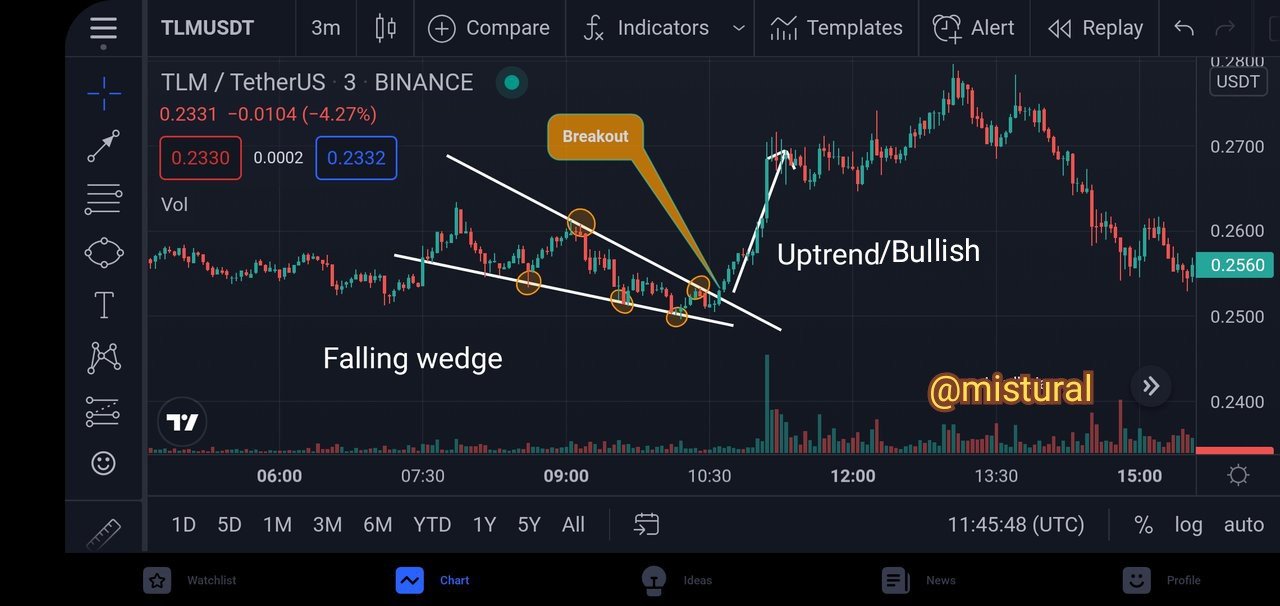
Falling Wedge: It refers to the falling of wedge patterns, that appears when the price of security/an asset price always touched the lower increases and decreases, as a result of contracting the range of the price that is been moved. It appears when a downward move of force in the market. It is always seen as a reversal pattern because the reducing of the ranges means that the bearishness with consideration to an asset is losing steam. The falling of wedge pattern always shows when an upward move in force in the market, and it is supposed to be a bullish pattern.
It's because a decline in the range may indicate that the correction of the price of the benefit is going smaller and it will be a strong uptrend. And it is always formed when the price of the safety agreement is due to the decreased lows, and decreased highs made by the price.
- How To Identify A Falling Wedges
Just like I talked about the rising wedges, I'll state the characteristics and the review of the falling wedges.
| Characteristic | Reviews |
|---|---|
| Volume Trend | It is always seen downward |
| Two down slopping trendlines | the two lines are placed on; one is through the header and one through the footer. And both slanted downward and at the end cut across. |
| Multiple touches | These wedges formed o the price chart of the traded token, hence have to touch each of the up-slopping lines drawn to indicate the wedge pattern formed on the price chart. |
Do the breakout of these Wedge Patterns produce False Signals sometimes? If yes, then Explain how to filter out these False signals.
Yes, the breakout pattern can generate a false signal at times, but we should keep in mind that this happens infrequently because the technique is entirely focused on the market trend, that is, market movement (uptrend or downtrend).
Considering breakouts are price movements in a chart that lack the required level of strength to primary urge the price to continue in its direction, traders must exercise extreme caution while trading them.
As a result, when a trader observes a false breakout, the first thing he or she should do is give the market some time. This is done mostly to allow the already-forming trend to finish, allowing the direction of the trendlines to be determined and made very evident.

Let me quickly show an example through the above chart, in this example, I'll make use of one of the popular indicator Relative Strength Index (RSI), this indicator shows oversold and overbought zone. For the oversold zone this is when the seller are tired of the market this signal a buy order for a falling wedges while overbought zone is when the buyer are tired of the market this signal a sell order for the falling wedges.
Another crucial thing a trader needs to avoid false breakouts is to possess one of the most important characteristics of a successful trader: patience. A trader must learn to devote a significant amount of time to the market in order to observe where and how the market is trending.
Show full trade setup using this pattern for both types of Wedges.( Entry Point, Take Profit, Stop Loss, Breakout)
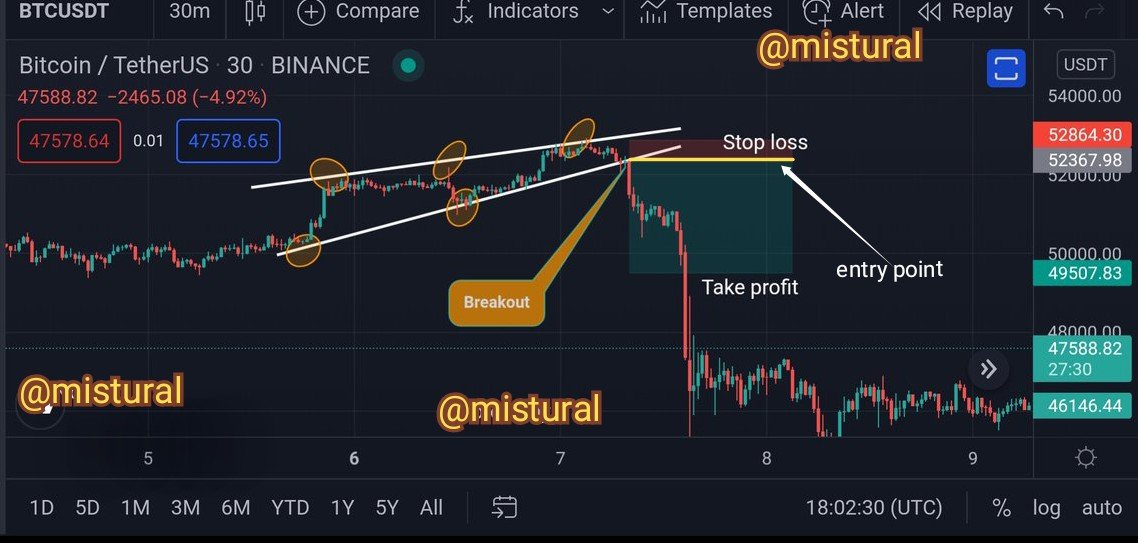
- Trade Setup for Rising Wedge
As the name implies, therefore in the price chart you will notice an uptrend/rising wedge where the trend lines touch both slopes drawn. Therefore, where the price of the token experienced a breakout is simply our entry point, the resistance line, therefore, serves as the take profit which is placed above the slope., and the support line our stop loss will be drawn a little below the slope line. All this is further explained in the screenshot below.
- Trade Setup for Falling Wedge
Similarly, As the name implies, therefore in the price chart you will notice a downtrend/falling wedge where the trend lines touch both slopes drawn. Therefore, where the price of the token experienced a breakout is simply our entry point, the resistance line, therefore, serves as the take profit which is placed above the slope., and the support line our stop loss will be drawn a little below the slope line. All this is further explained in the screenshot below.

Conclusion
There are numerous trading patterns, and the wedge pattern is simply one of them. As I previously stated, this pattern involves two trend lines that merge towards the end of their trend. The rising wedge pattern and the falling wedge pattern are the two most common types of wedge patterns.
We've also noticed that using this pattern alone can result in some misleading signals, therefore we use indicators like the HalfTrend indicator we used in question 3 above to avoid these false signals.
This is a great honour for me as I came back from a long trip and the first lecture I attended was made by Professor @sachin08, I'm using this opportunity to thank the professor for this wonderful piece of lecture and I pray God will continue to increase your knowledge.
God bless all the readers and my supporters ❣️❣️
