[JAPANESE CANDLESTICK] - Steemit Crypto Academy Season 5 - Homework Post for Task 10
1a) Explain the Japanese candlestick chart? (Original screenshot required).
b) In your own words, explain why the Japanese Candlestick chart is the most used in the financial market.
c) Describe a bullish and a bearish candle. Also, explain its anatomy. (Original screenshot required)<
JAPANESE CANDLESTICK
A rice trader called Munehisa Gonna came up with a development in the 1700s, he observed that the emotions of traders affected the price of the rice and the market at large because of his understanding of demand and supply he was determined to know what causes price rotation and how the market and traders reacts to each rotation and this was how he came about with what is known as the JAPANESE CANDLESTICK.
Coming into the financial instruments, there is what is known as technical analysis which helps traders of these instruments to analyse the market properly and make profits from the market and this is where the JAPANESE CANDLESTICK comes in, it is one of the most important technical analysis tool used by traders of financial instruments so as to maximize their profits and reduce their loss.
The Japanese candlestick chart is basically a graphical representation of the movement of the price of an asset, it is formed after there is a tussle between the buyer and the sellers of an asset which then gives a final result that then indicates whether the sellers prevailed or the buyers did. The Japanese candlestick pattern was first used in trading financial assets in 1870 in the Japanese stock market after which it was then introduced to the other part of the world by Steve Nison which has then become quite popular and important technical indicator as it gives more accuracy compared to other charts techniques.
The chart pattern has a way of communicating with the traders, showing different patterns giving hints to how the future movement of the price of an asset will be and this is always useful for traders who understands it's language. It simply helps to show who is dominating in the market either the buyer or the seller or that particular asset.
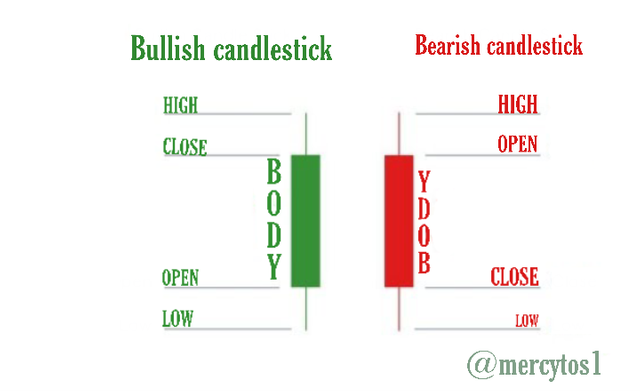
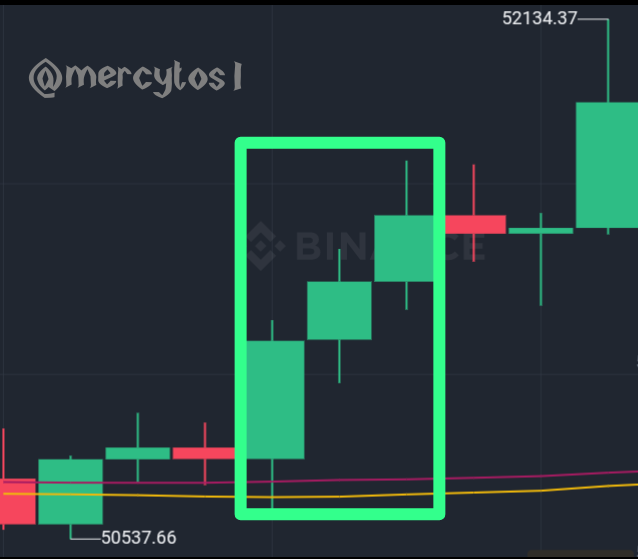
The screenshot above shows how a bullish and bearish candlestick looks like, many atimes the color green is used to denote a bullish candlestick while the red denotes a red candlestick but on some occasions the color are changed depending on the user or platform to black and white.
Let's see what the labbelled part of the candlestick means below;
Open: this is also known as the opening price which shows the begining of the price movement, the price then keep moving from that point upward or downward.
High: this is the part of the candlestick that shows the highest price the asset attained at a specific time.
Low: this is the part of the candlestick that signifies the lowest point or price that the price of an asset got to at a specific time.
Close: this us the part of the candle that shows the price at which the candle closed or got to before the begining of the next candle within a specified time.
Body: the body shows the distance that the price moved within a specific period, it is the space between the open and close price and this is what shows if there was a greater increase or decrease in price.
The shadow is the space between the high of a candlestick and the upper part of the body, this is known as the upper shadow while the lower shadow is the space between the low and the lower part of the body of a candlestick. Whenever the close of a candlestick is lower than the open prove then the market is said to be bearish and shows a red candle but when the close prove is higher than the opening price then the market is said to be bullish and comes with a green candlestick.
The Japanese candlestick has various patterns in which traders look out for when analyzing the market to know how to place their trade. Some of the patterns are indicated below.
1 . HAMMER
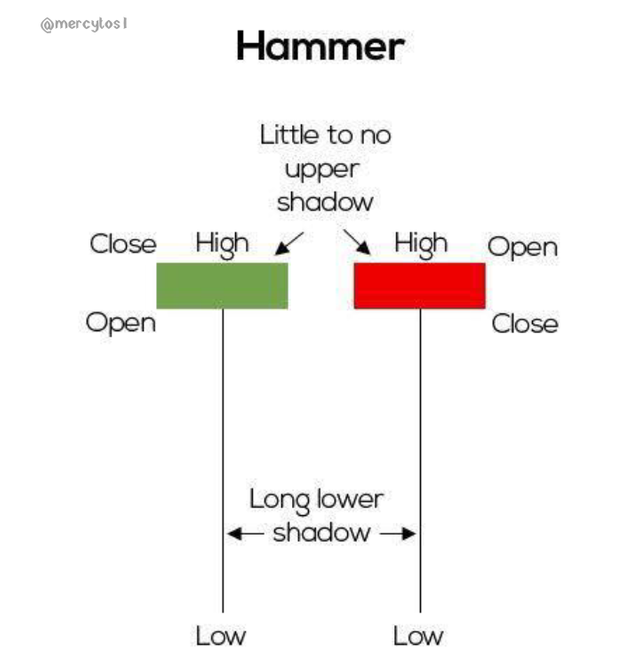
The hammer as shown above is a candlestick with a long lower shadow, a small body and a tiny or no upper shadow at all. This usually indicate a reversal from either a uptrend to a downtrend or a downtrend to an uptrend. Depending on the color of the candlestick it appears on.
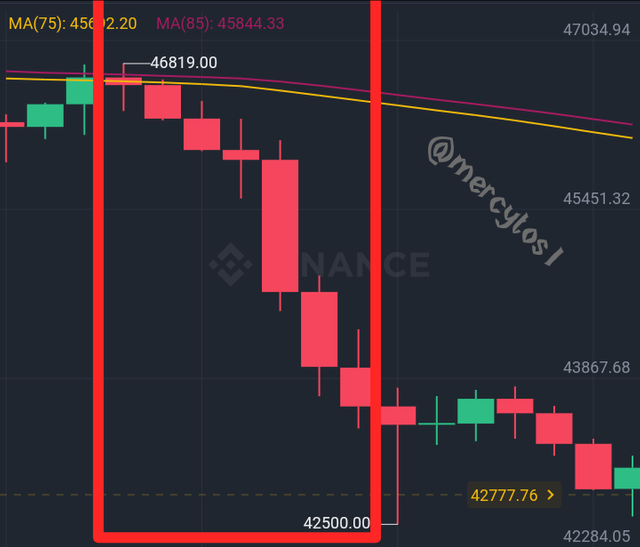
2 . BEARISH AND BULLISH ENGULFING PATTERN
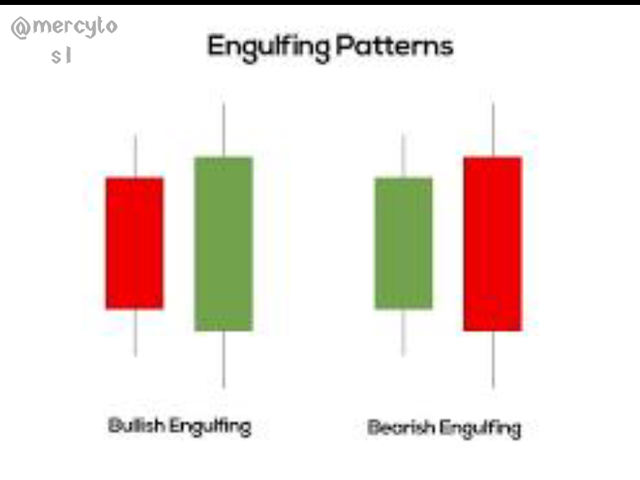
The bullish engulfing pattern usually appear during a downtrend as it usually signifies a reversal in the movement of a price from a downtrend to an uptrend. The green candlestick usually engulfs the red candlestick i.e the red candlestick will be smaller than green candlestick with the whole candlestick not higher or below the green candlestick.
While the bearish engulfing pattern usually appear at the top of an uptrend which usually signifies a reversal from an uptrend to a downtrend. The red candlestick is usually longer than the green candlestick, the green candlestick will never go above or below the next red candlestick.
3 . DOJI
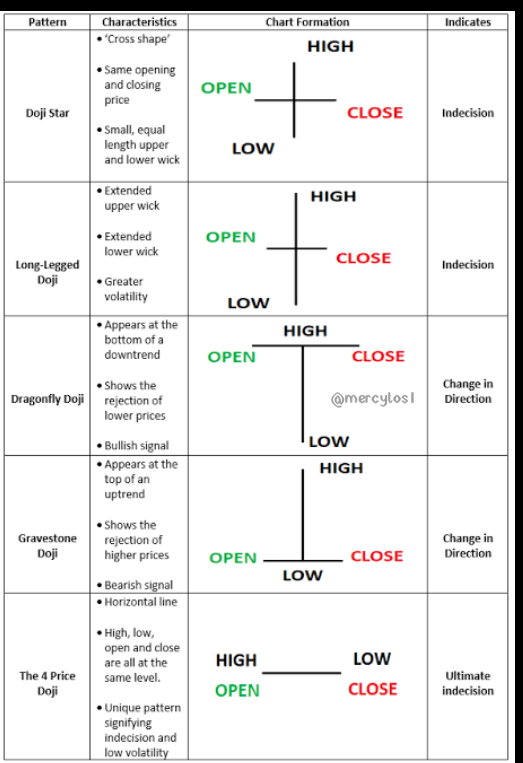
The Doji pattern consist of 5 different patterns which are the
1 . DOJI STAR
2 . LONG LEGGED DOJI
3 . DRAGONFLY DOJI
4 . GRAVESTONE DOJI
5 . 4 PRICE DOJI.
This patterns usually means one or two things depending on when they are formed. The screenshot above shows a more extensive description of what the DOJI's are and what they mean.
The first thing to know is that the Japanese candlestick is a very good pattern which has a higher accuracy in price prediction to traders. It is quite popular because it can work with every financial market and has proved to be very useful. Another advantage is that it has a graphical representation which makes it easier for the chart to be read and analyzed, it also helps to identify market patterns on time and can work on any time frame chosen by the trader.
It also gives accurate market data for both pass data and current data, which ensures that it's easier to predict the future price. With just a look at the market it is easy to detect what trend the market is in at a particular time either a downtrend, an uptrend or a sidewy movement. It also gives diverse signals such as reversal patterns to both a bullish and bearish market.
Another thing that can't be sidelined is that with the Japanese candlestick one can also make use of other technical analysis tool to get a more clearer signal and a more market structure which Aids the analyzing of the asset. It is easily understood and shows short and vital data about a market at every particular time.
BULLISH CANDLESTICK
The bullish candlestick is an indication that the buyers are taking over the market and this increases the price of the asset as long as the buyers are still putting more pressure. It usually signifies that the market is about to start an uptrend after a certain downtrend. The bullish candlestick is green in color as shown in the screenshot above and the closing price is always above the open price.
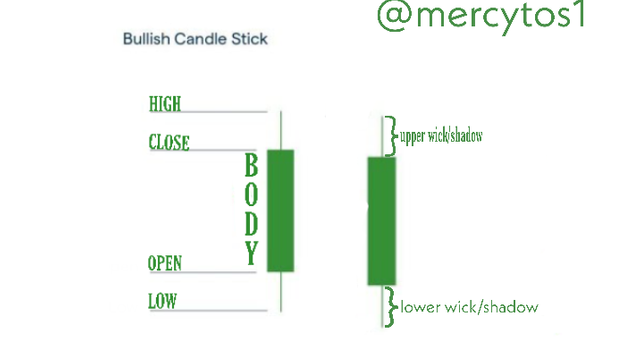
ANATOMY OF BULLISH CANDLESTICK
The screenshot above shows the anatomy if the bullish candlestick, it gives a graphical representation of what the candlestick entails.
Closing price: this is the price at which a bullish candle closes, it shows the price where the asset close at a specific period in a market, it is usually the upper part of the body.
Body: this is the middle part of the candlestick that indicates how long the price of an asset moved and also it's the gap between the close and the open price of an asset at a particular time.
Upper wick: the upper wick is also known as the high of the bullish candlestick, it shows the peak price at which an asset has moved in a particular time.
Open price: this is the price at which the movement of the price of an asset started from, it is the begining of the price movement at a particular time.
Lower wick: this is the lowest price the asset touched at a particular period in the bullish candlestick.
BEARISH CANDLESTICK
The bearish candlestick is the candles which indicates the begining of a downtrend in a chart, simply put it's the opposite of the bullish candlestick. The red colour is usually used to identify the bearish candlestick.
It helps traders to know when a bearish trend starts and how strong the trend is, this simply means there are more sellers in the market at that particular time and the market is bleeding just as some people say. This then brings about the fall in the price of an asset from a higher price to a lower price. The bearish candlestick opening price is usually above the closing price.
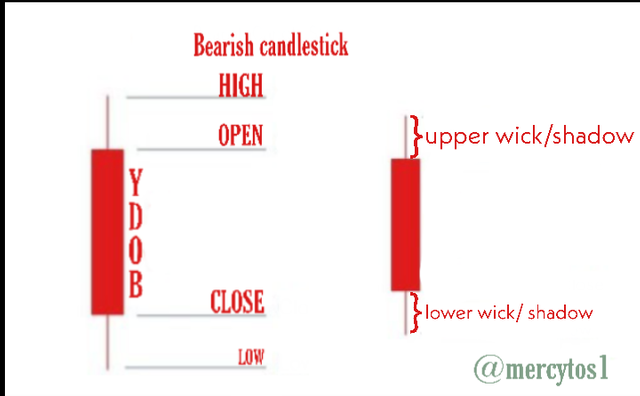
ANATOMY OF A BEARISH CANDLESTICK
From the screenshot above we notice some vital parts of the candlestick, which are quite similar to the bullsih candlestick.
The body of the bearish candlestick shows the length or distance of the price movement of an asset at a particular time from a higher price to a lower price.
The upper wick / shadow also shows the highest price the asset touched before the movement downward while the lowest wick shows the lowest price the asset reached before the close of the candle.
The close is the price at which the candles fully formed at a particular time frame
The open is the price the candle started it's formation from at a particular time frame .
In conclusion, the Japanese candlestick is a very good indicator that traders can use in other to get maximum profit from the financial market and also boosts their confidence In entering a trade as it gives accurate signals to traders.