Crypto Academy Season 4 Advanced course week 8: Crypto Trading With Rate Of Change (ROC) Indicator
In your own words, explain the ROC indicator with an example of how to calculate its value? And comment on the result obtained.
Rate of change ( ROC ) is a technical indicator/oscillatory chart price indicator used for measuring the price of traded assets based on N periods of days.
It is used to determine the performance of the current price of a trading pair and price change with N number of days.
ROC helps traders to pinpoint important trading signals such as overbought, oversold, trend reversal and, trend price confirmation.
It's has a reading scale plotted against zero a rising ROC above zero confirms an upward trend movement while a below zero indicates a downward movement.
How to calculate ROC
In other to calculate the rate of change the following formula is used;
ROC = (current price - price of N periods back) / Price of N periods back * 100.
I will present ADA/USDT chart pair to complete the above calculation.
Two variables will be needed.
Current closing price of a pair
Current closing price of N period ago a trader can choose the number of N period that suits his trading strategy.
From the chart screenshot below taken from
investing.com
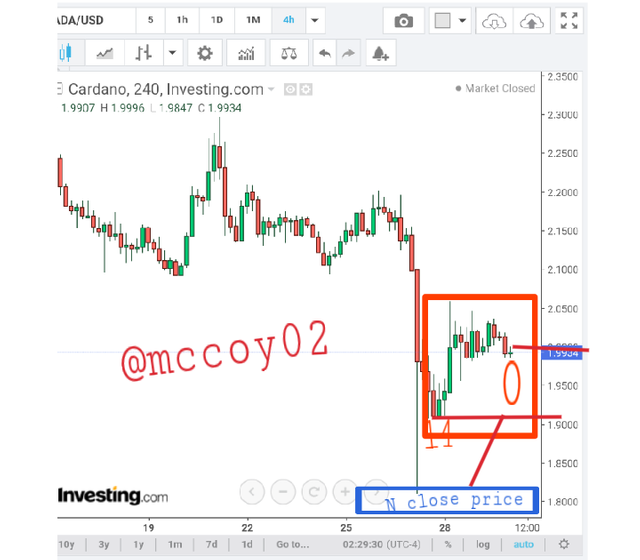
I will be using a 14 N period of the closing price pair.
It can be obtained from the above screenshot the current closing price of the ADA pair is = 1.9934 and the N price of candle 14 is = 1.9058
ROC = 1.9934 - 1.9058/ 1.9058 × 100
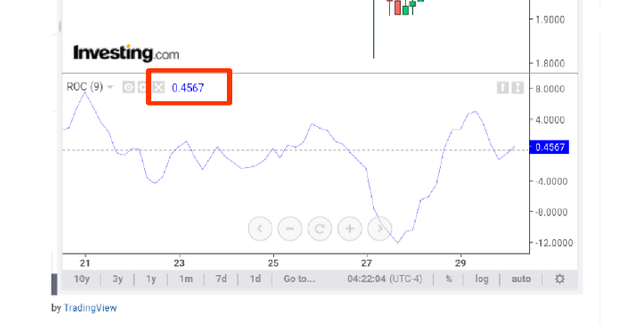
ROC = 0.0876 / 1.9058 × 100
ROC = 0.04596 × 100
ROC = 4.596%
Below shows the screenshot of the ROC value related to the above calculation which certified the formula is valid for calculating the ROC value of the market trend.
Demonstrate how to add the indicator to the chart on a platform other than the tradingview, highlighting how to modify the settings of the period(best setting). (screenshot required)
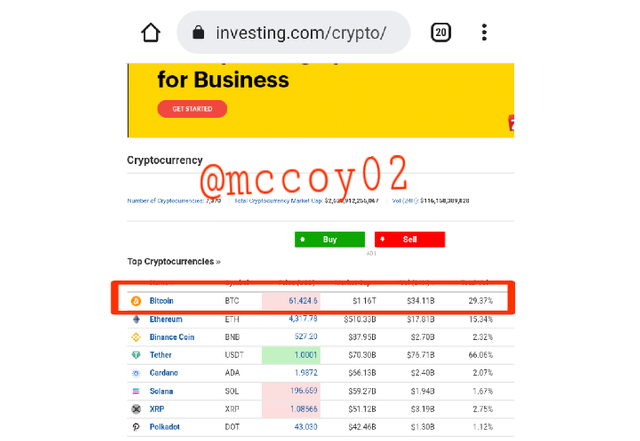
To complete this task I will be accessing investing.com it's a financial-based platform that provides users with multiple investment news and analysis.
- From the platform homepage, I will navigate to crypto
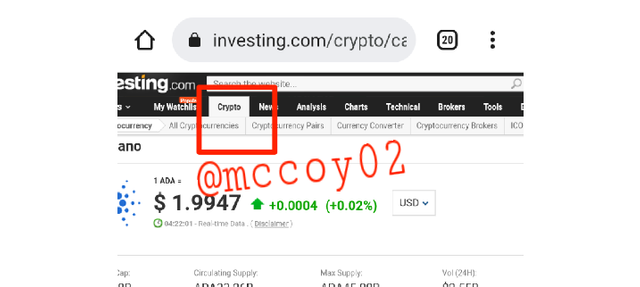
- Next I will select the crypto of choice which I will be providing its chart view and add the ROC I will click on BTC/USDT pair.
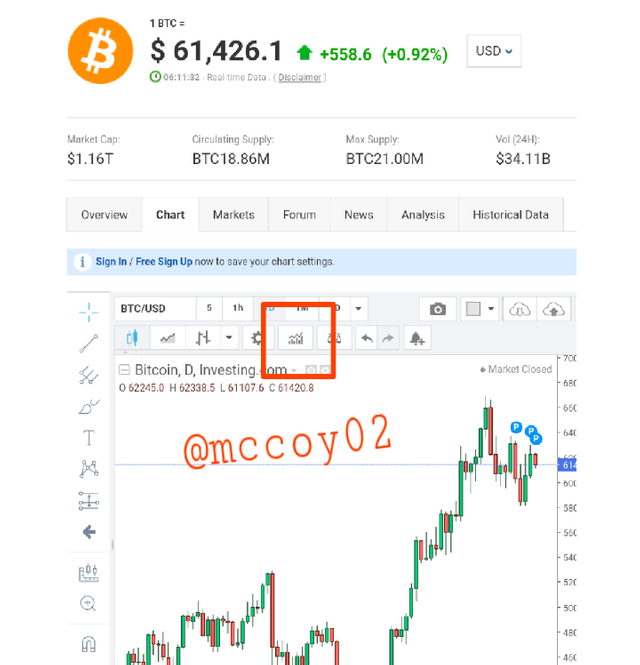
- Next is to click on the indicator tool marked below.
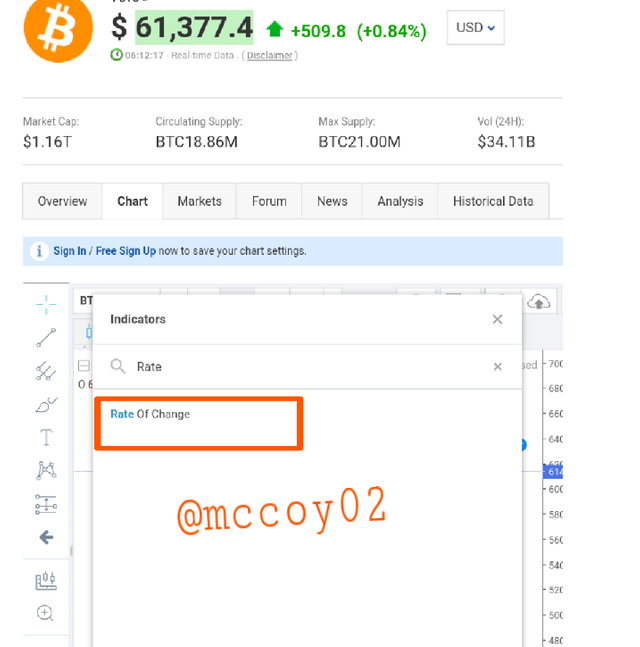
- Search for the rate of change and add to the chart.
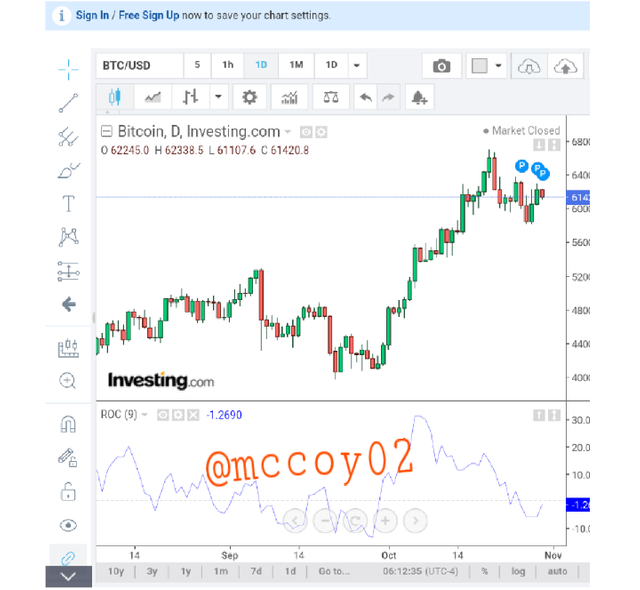
- Below shows ROC view of BTC/USDT.
How to modify the settings of the period(best setting). (screenshot required)
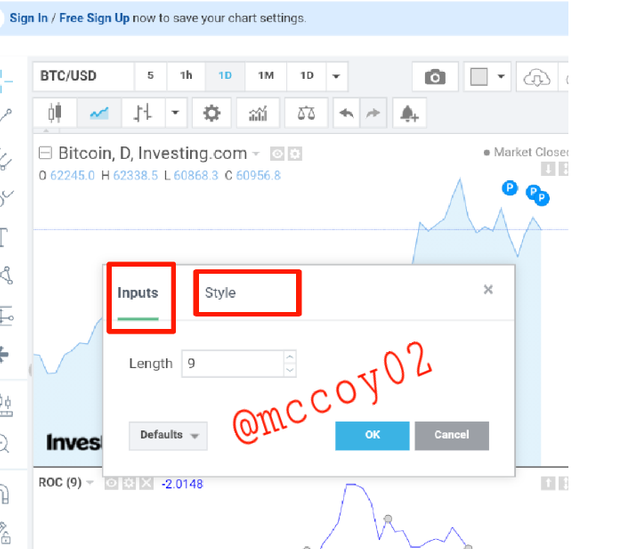
- To modify the ROC chart click on the setting icon.
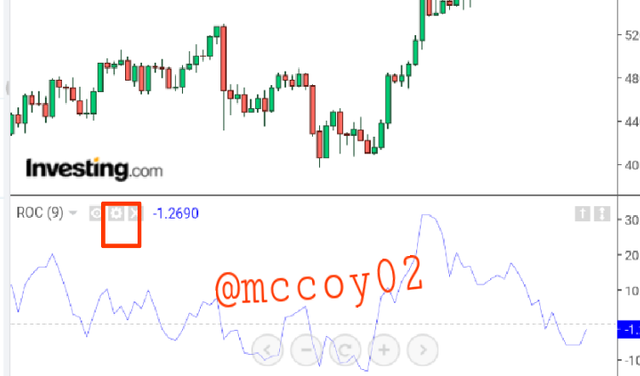
- From the setting icon traders will be presented with ROC modification settings traders from here can be able to play around with setting tools by increasing/decreasing the number of periods based on different timeframes they would ROC to cover on each trading chart this can be done under the input section from the style section a trader can set how they want their indicators to look like such as the width for zero line and ROC.
Below shows the ROC modification setting the input and style with which a trader can play around with.
Best settings
Choosing the best setting for trading the ROC indicator value will depend on a trader's trading strategy for long-term traders using ROC with a high number of periods will be best like 20-25 this will help make such traders have more view of price action.
While for short-term traders 9-12 period setting will be best/recommended.
What is the ROC trend confirmation strategy? And what are the signals that detect a trend reversal? (Screenshot required)
Trend confirmation in ROC can be observed when the trending price of an asset/pair is in agreement with the ROC indicator.
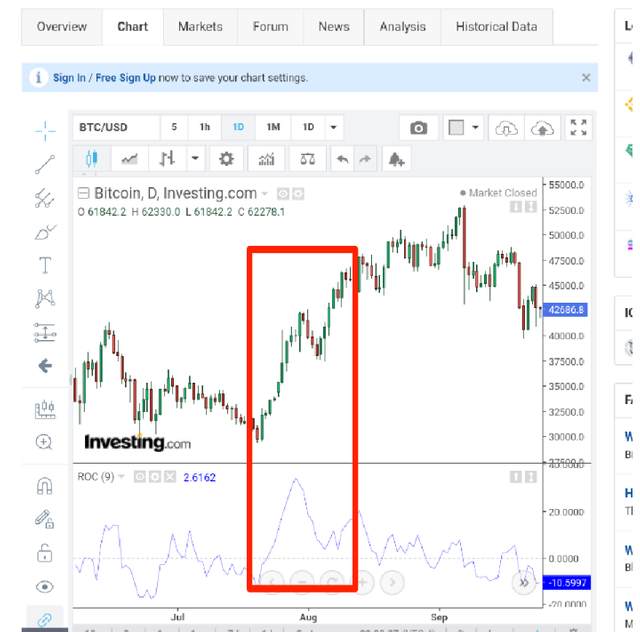
Uptrend with ROC indicator
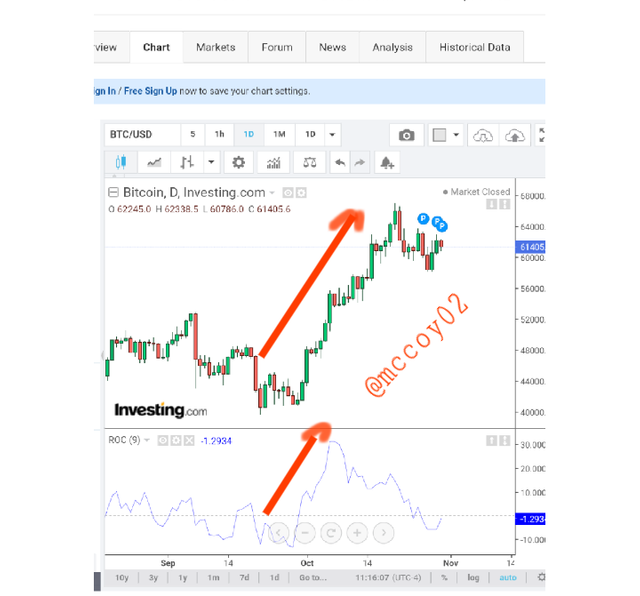
The screenshot above shows BTC/USDT pair with ROC indicator in correlation/agreement with BTC price trend this shows/indicates a price confirmation in an upward direction, the strength of the ROC indicator will increase and stay above zero line.
Below also shows a downtrend price confirmation with the ROC indicator showing a strength below zero with a decrease in indicator strength also it can be seen the price of BTC and the ROC indicator is in the same direction confirming
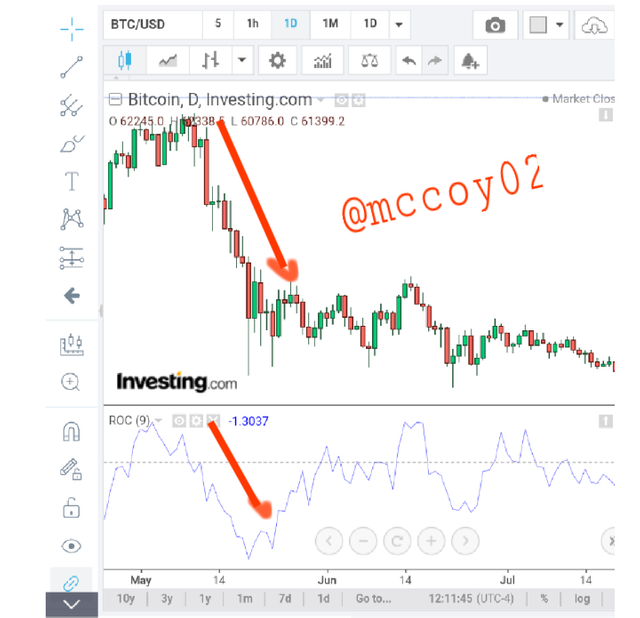
Trend reversal occurs when there is a divergence between the asset pair and a trading indicator, this means both the indicator and chart price trend line move in the opposite direction.
A divergence with the Rate of change indicator occurs when price and indicator movement is in the opposite direction.
As shown below.
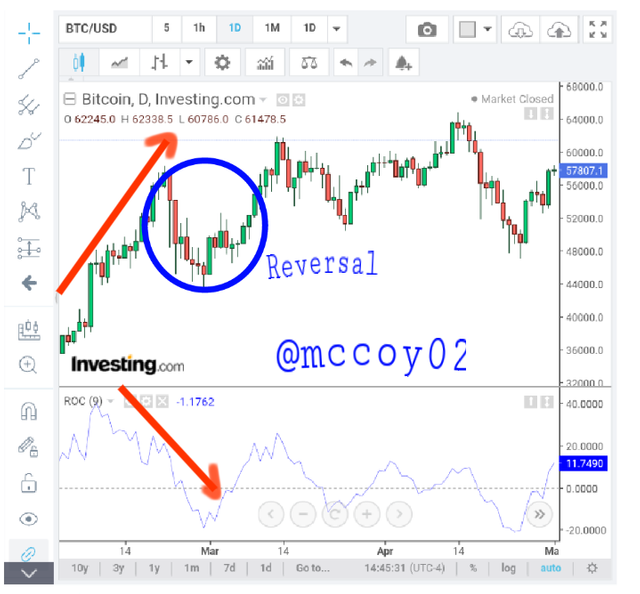
From the screenshot above it's can be seen the two red arrow shows different directions in diverge pattern with a price trend reversal in a circle. this shows when a trader observed such a pattern while trading he should prepare for a price reversal by being on guide to open a good position.
A trader can also expect changes in the current price of a trend when it is overbought or sold this can also be used to confirm trend reversal of a price trend.
For the ROC when there is a rise above 3% level or below -3% there is an indication of price overbought or sold.
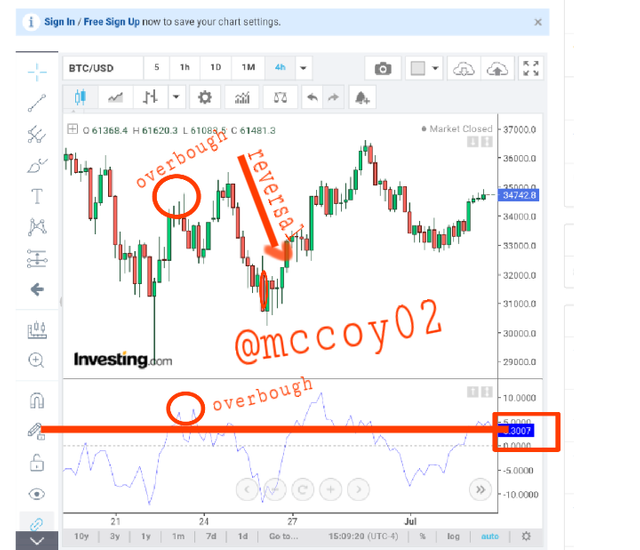
Above shows ROC above 3% indicating an overbought signal in BTC pair as also seen a trend confirmation showing a reversal in price occurs when the buying pressure starts becoming weak leading to a reversal in price.
What is the indicator’s role in determining buy and sell decisions and identifying signals of overbought and oversold (screenshot required)
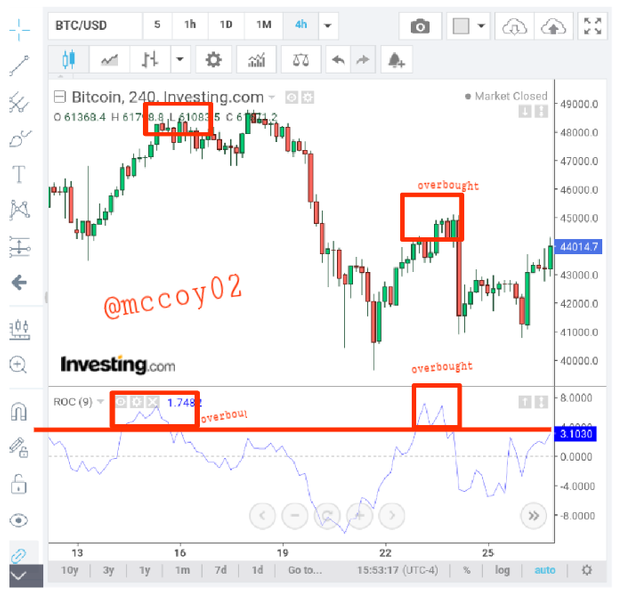
The Rate of change is plotted against zero overbought and the sold signal can be represented these will be used by traders to make decisive decisions when trading.
As mentioned an indication showing ROC above the 3% level is an overbought confirmation while a reading below -3% is an oversold signal.
The role of the ROC indicator is to help traders determine how and how to enter a trade position when there is market movement indicating an oversold signal will show a trader needs to be getting ready for a price reversal and with the help of the ROC indicator a trader can make a very good market entry.
The above chart shows a real price reversal on each overbought signal it can also be seen that the ROC indicator is above the 3% level which indicates price correlation between the price trend and the indicator it can therefore be seen that an oversold signal leads to price pullback a trade can take advantage of this movement by watching price overbought which leads to price pullback or reversal.
Below shows ROC reading below -3% indicating price oversold with weak ROC here we can observe how on each saturated oversold price BTC tend to reverse or pull back gaining momentum in positive price.
A trader can use the above overbought and oversold signal to take maximum advantage of the price trend also with a proper market entry and a stop loss used on each opened position trade losses on each trade can be minimized.
How to trade with a divergence between the ROC and the price line? Does this trading strategy produce false signals? (screenshot required)
Bullish divergence
Divergence always occurs when the price trend and the said indicator move in the opposite direction.
A bullish divergence occurs when there is a downtrend price movement with and also the ROC indicator moving in a higher high or upward direction indicating a weak selling pressure showing sellers are taking profit and exiting the market this will now lead to a bullish market movement or trend formed.
To apply this on the price trend line, a long line will be traced to break the trend line this will give a trade clue on how they can apply to take profit and stop loss on the trade.
Below shows a bullish divergence chart.
Bearish divergence
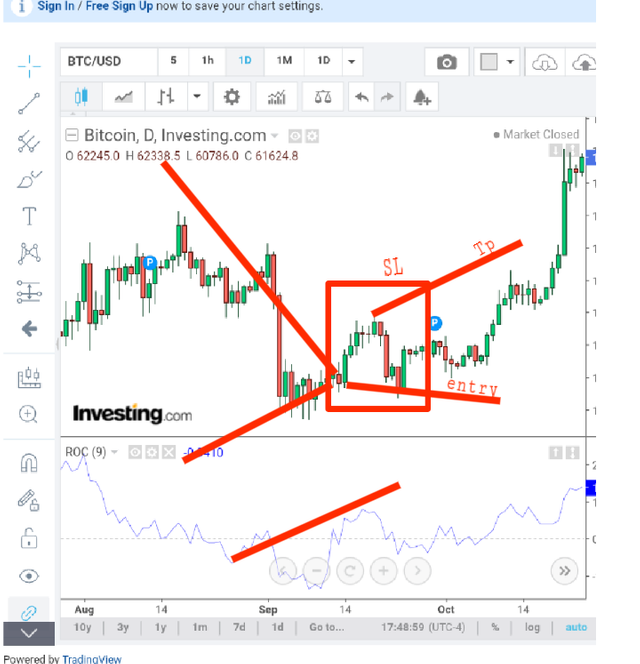
The bearish divergence occurs when there is an uptrend movement in price with the ROC indicator moving in a downward direction below show the support trend line and possible entry position with taking profit for trading.
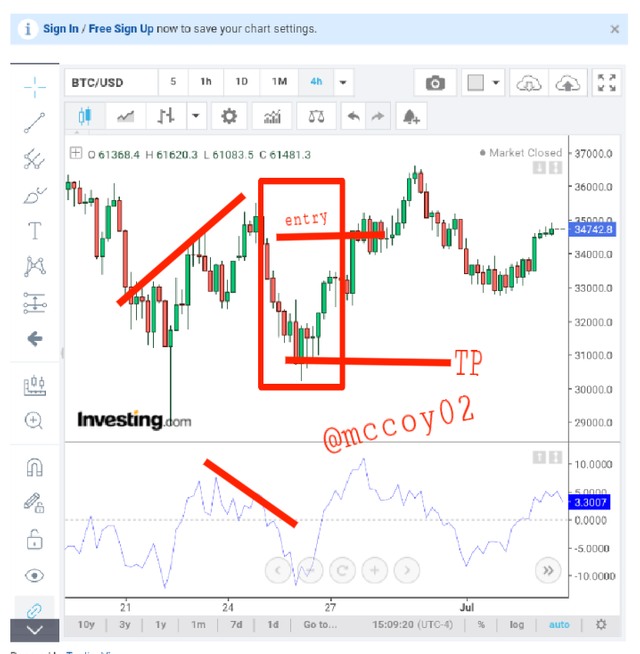
There is no 100% guarantee on any trading indicator to provide an accurate trade outcome, the ROC indicator has its limitations therefore it can produce a false signal it is needed/required for traders to wait on price confirmation before entering any trade.
How to Identify and Confirm Breakouts using ROC indicator? (screenshot required)
The ROC indicator can be confirmed when the ROC line begins to move away from the zero line zone.
The use of support and resistance in price movement will help traders know when is moving toward or away from a price trend.
Review the chart of any crypto pair and present the various signals given by the ROC trading strategy. (Screenshot required)
To complete this part I will be using BTC/USDT pair.
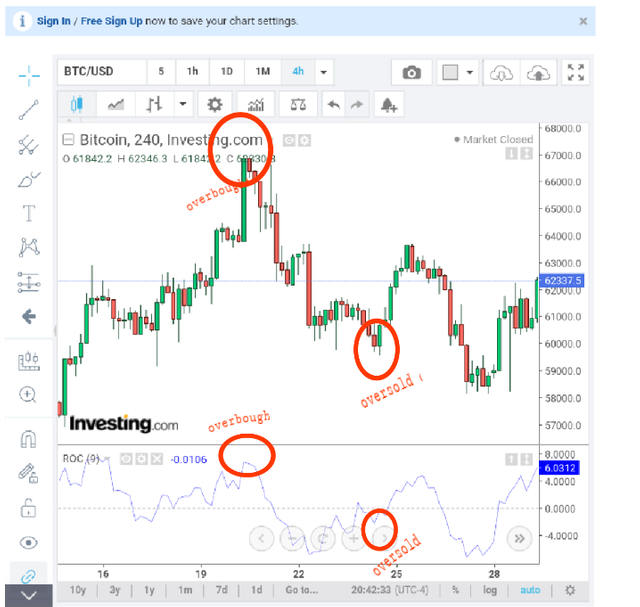
As stated earlier the ROC indicator can be used to detect different trading signals which include overbought, oversold, trend reversal, trend divergence, and more.
First I will be presenting BTC/USDT today's current price at above $62,000 looking at the screenshot it can be seen the price trend correspond with the ROC indicator the market is at a big buying pressure showing the bulls are absolutely in charge of the current market looking at the ROC we can see it above zero zone reading at 0.9% which also shows an overbought market.
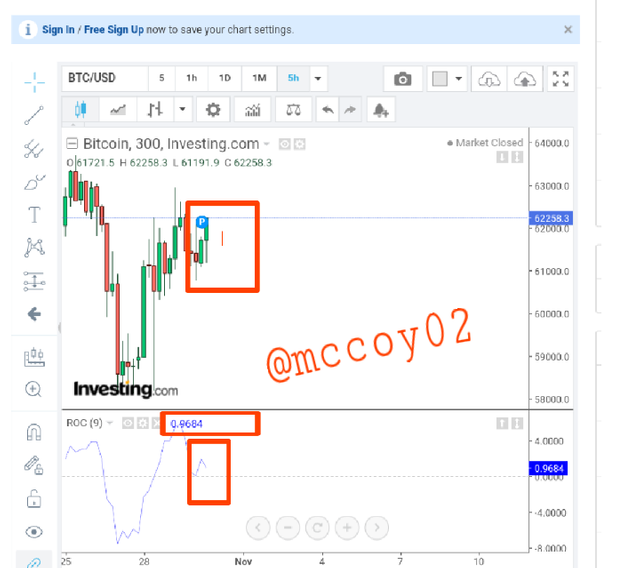
Currently, in this situation, a trader will be recommended to wait for either price confirmation or breakout signal.
The below view presents traders with a real price trend and indicator confirmation signal as said earlier when an indicator follows the same pattern or direction price trend then we can confirm a real price movement.
In the above situation, a trader will hold his trading position with a proper market entry order with 1:1 risk management take profit order and stop loss.
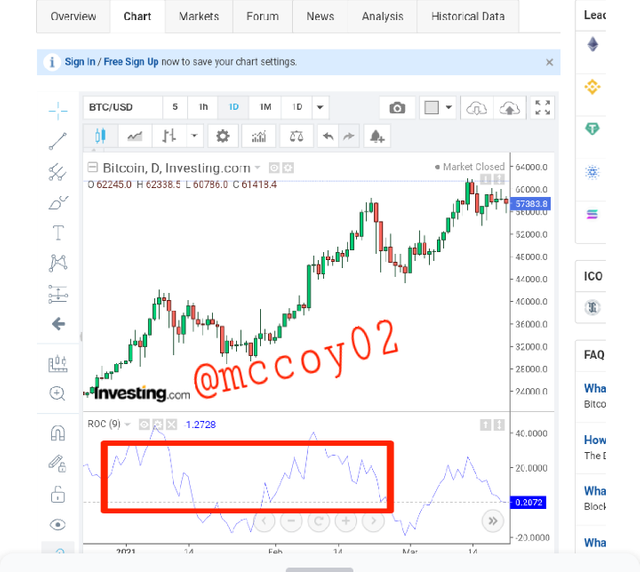
Price overbought and oversold are represented using a reading above +3% for overbought and below -3% for sold a trader can use this reading to check price reversal as seen below from the screenshot at price overbought we saw a quick reversal in price likewise for oversold we saw a quick reversal.
In this situation, traders can take advantage of the market by patiently waiting for the price confirmation in an oversold or overbought trend.
Conclusion
ROC is an important indicator used by traders to measure/determine important trend signals in the market if utilized fully a trader will take maximum advantage of market price movement it reading scale above 3% shows an overbought signal while below -3% is oversold.
It can be calculated easily without much parameters, trend and indicator divergence can easily be observed using ROC indicator market breakout and detection of price reversal can be best handle with ROC.
Hello @mccoy02,
Thank you for participating in the 7th Week Crypto Course in its 4th season and for your efforts to complete the suggested tasks, you deserve a Total|8.5/10 rating, according to the following scale:
My review :
Good content in which you were able to answer all questions related to the ROC indicator with a clear methodology and depth of analysis which is a testament to the outstanding research work you have done.
Thanks again for your effort, and we look forward to reading your next work.
Sincerely,@kouba01