Trading with Accumulation / Distribution (A/D) Indicator - Crypto Academy / S4W5 - Homework Post for @allbert
.jpg)
I like to thank professor @allbert as they explain the A/D indicator in a very simple way with the graphics and I also learn how to use the A/D indicator in the crypto and with that, I also earn some profits. Thank you very much once again for providing the very informative lesson.

Homework Question

1- Explain in your own words what the A/D Indicator is and how and why it relates to volume. (Screenshots needed).
2- Through some platforms, show the process of how to place the A/D Indicator (Screenshots needed).
3- Explain through an example the formula of the A/D Indicator. (Originality will be taken into account).
4- How is it possible to detect and confirm a trend through the A/D indicator? (Screenshots needed)
5- Through a DEMO account, perform one trading operation (BUY or SELL) using the A/D Indicator only. (Screenshots needed).
6- What other indicator can be used in conjunction with the A/D Indicator. Justify, explain and test. (Screenshots needed).
Q.1 Explain in your own words what the A/D Indicator is and how and why it relates to volume. (Screenshots needed).
The accumulation/ distribution(A/D) indicator is an indicator that is used to help in identifying whether a financial asset is accumulating or distributed. It simply helps the trader to identify the trade entry point and also helps them to firm the trendline and future trends. In simple words, Accumulation means the large quantity of the particular financial asset is buying by the investor/traders. This means the demand is more than supply and in this situation, you will place the buy order to get profit from the market. If the particular financial asset is distributed means that particular asset investors selling their position of that particular financial asset it means the supply is more than demand in this scenario you have to place the sell order to get profit from the trade of that financial asset.
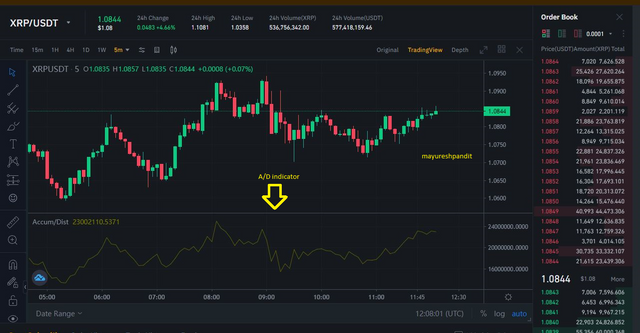
In the below image you will see the A/D indicator later on I will show the steps to add the A/D indicator.
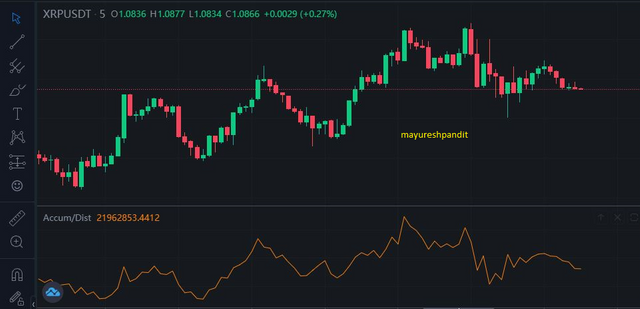
It helps traders/investors in the finding of early signs and alerts of the financial asset and also helps to predict the future price and trends of the financial assets.
Relation of A/D indicator with Volume
As you saw in the below image you will know when the price of the SHIBA/USDT is going up their volume also rise and the A/D indicator line so it is clear you have and idea its relation with the volume.

As you saw in the below image you will see their huge drop in price and it also reflects in the volume and A/D indicator line.
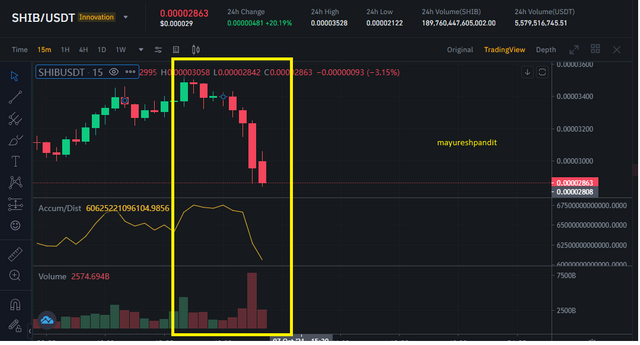
This relation with volume is because we use the volume in the calculation of the A/D indicator line as drops or increases in the volume straightly impact the calculation of the A/D indicator.
Q.2 Through some platforms, show the process of how to place the A/D Indicator (Screenshots needed).
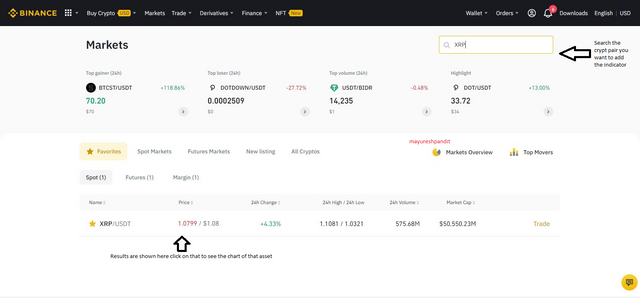
I am using the Binance to the analysis the crypto market charts. It is really simple to add the technical indicator on the chart. To add the Accumulation distribution indicator on the chart please follow the below steps.
Step 1 :-
Login to the Binance wallet using your login details and choose the market option from the menu.

Step 2 :-
Please choose the desired crypto pair from the list. I am choosing the XRP/USDT pair.
Step 3 :-
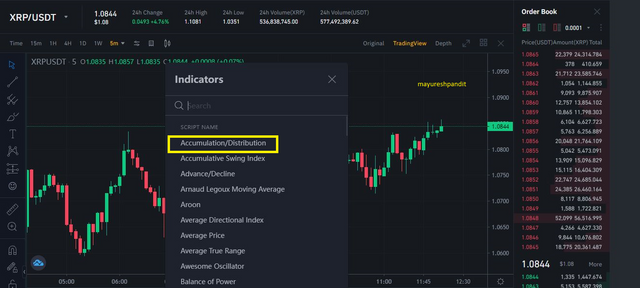
You will see the chart screen like the below image and please select the technical indicator option to add the A/D indicator on the chart.
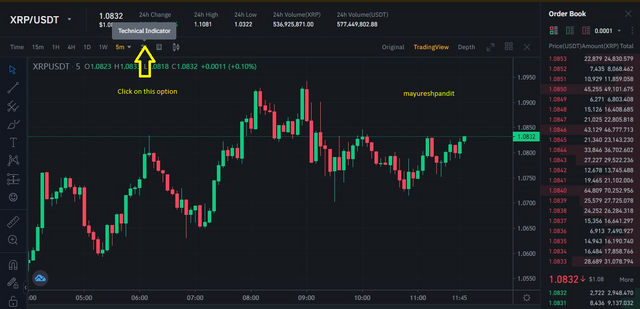
Step 4:-
Please select the Accumulation /Distribution option from the dropdown.
Step 5:-
You will see the A/D indicator below the price chart as shown in the below image and you will also change the color and opacity of the indicator from the settings.
Q.3 Explain through an example the formula of the A/D Indicator. (Originality will be taken into account).

As per the formula to calculate the A/D we need to calculate the Money Flow Multiplier first.
So let’s assume that We had a closing price of 100 and low price will be 93 and High price is 105 and period will be 1/2 and volume for that period is 1 M and previous A/D we will assume that 200,000
Money flow multiplier = (100-93)-(105-100)/ 105-93 = 0.16
Now we get a money flow multiplier now we will calculate the money flow volume
Money flow volume = 0.16 x 1 M = 160,000
A/D = 200,000+ 160,000 = 360,000
Q.4 How is it possible to detect and confirm a trend through the A/D indicator? (Screenshots needed)
As you see in the below image A/D line is also going into the upside while the price is also on the uptrend but how do we detect this uptrend before its starting lets took this in very detail.
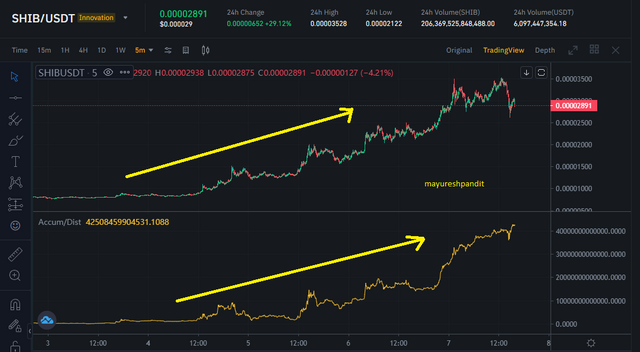
As you see in the below image you will observe that in A/D indicator line is find some resistance at a certain point and at that time we didn't see much price action but at the point resistance of the A/D indicator line breaks that time we have a good time to buy a SHIBA/USDT and also we see A/D indicator maintains themself above the resistance line and because of the A/D indicator we able to predict early the uptrend of the SHIBA/USDT.

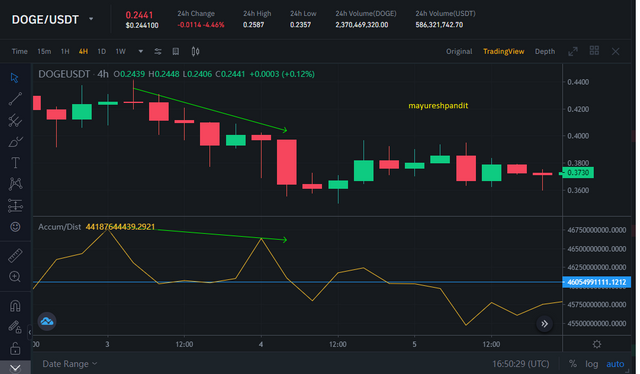
As you see our A/D indicator and price charts both show the downtrend of the DOGE/USDT so we will see this trend in details

As you see in the below image When the price starts falling that time A/D indicator line is not able to hold the support line and because of that this downtrend is started and keeps falling.
Q.5 Through a DEMO account, perform one trading operation (BUY or SELL) using the A/D Indicator only. (Screenshots needed)
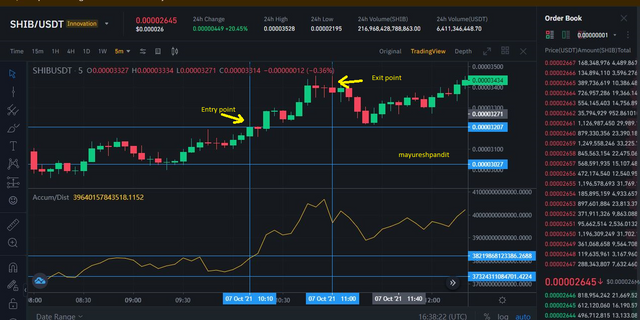
As you saw in the above image when the resistance level of the A/D line indicator will break at that time I placed the buy order as I predict it will go up and after I seeing the downfall in the A/D LIne indicator that time I exit from my long position and book my profit.

As you saw in the above image I buy the 3176959 SHIBA tokens at the price of 0.00003368 USDT and IT cost me around 106.99 USDT and took the profit at 0.00003442 USDT prices and sold 3176000 tokens and I get the 109.37 USDT so I had a total profit of 2.36 USDT and 959 SHIBA token.
Q.6 What other indicator can be used in conjunction with the A/D Indicator. Justify, explain and test. (Screenshots needed).
I think the A/D indicator will better work with Moving averages and support and resistance lines of price action. To become successful with the A/D indicator we will need the help of moving averages to confirmation on the trend line.
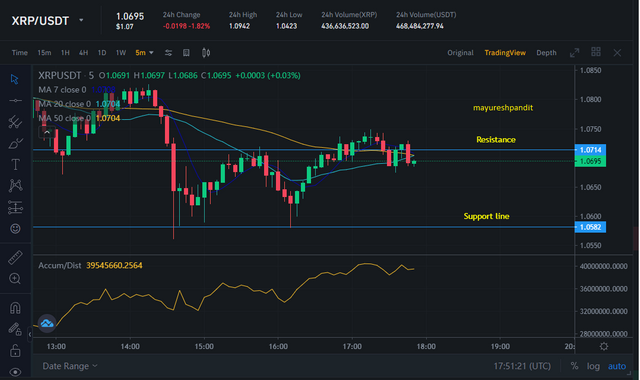
As you see in the above image I used the 3 moving averages (7,20,50) and I saw there is support and resistance level of XRP/USDT as a lot of time price is support near that support line and it will have resistance near that top resistance level line.
After seeing the A/D indicator it will seem clear that this is in the uptrend and It also confirms the uptrend by all 3 moving averages.
Before entering into the trade need to confirm with another indicator I choose the moving average as it shows the trend line using historic data of the asset so it will be better to confirm the trend by using the bother indicator before proceeds to buy.
Conclusion
As we saw today A/D indicators have directly shown us Is financial asset is accumulated or distributed In simple words it shows the supply is more or demand is more and it really helps us to find the trend of that particular financial asset. In the crypto market, we can't really predict the coin is really gone up or down but with the A/D indicator, it is more simple to identify the trend.