REPOST - Steemit Crypto Academy Season 4 Beginners' course - Homework Post for Task 10: [Candlestick Patterns ]
Hope you are all doing well. Today i am writing season 4 , beginner level task 10 which is set by professor @reminiscence01 abiut Candlestick Patterns. I'll be doing following part of task :
Explain the Japanese candlestick chart? (Original screenshot required).
b) In your own words, explain why the Japanese Candlestick chart is the most used in the financial market.
c) Describe a bullish and a bearish candle. Also, explain its anatomy. (Original screenshot required)
Explain the Japanese candlestick chart? (Original screenshot required).
Source
Japanese candlestick charts are so called because they were developed in Japan in 18th century . Japanese candlesticks represent price movement of an asset during a particular time frame. Candlestick represents opening price, closing price, high and low made by an asset over a particular time frame. The length of each candlestick depicts chamge in price over that time frame set by a trader. For example , if we want to see price movement in 1 minute over a period of one hour , we will be able to see 60 candles i in 1 hour where each Candle represent the price movement over one minute. So Japanese candlesticks are the potential technical tools in the hands of traders .
Candlestick represents current price of an asset as well as price movement over a particular period. The technical analysts have thoroughly studied these candlesticks charts and devised certain patterns like an upward growing rally of candles in bullish market and a downwards going rally of candlee in bearish market. Other patterns are double top, double bottom etc. In addition depending upon the shape of candle, they have been given seprate names like doji, bullish engulfing, bearish engulfing etc. Each of these are said to represent particular price pattern and also help in predicting future price movement of an asset.
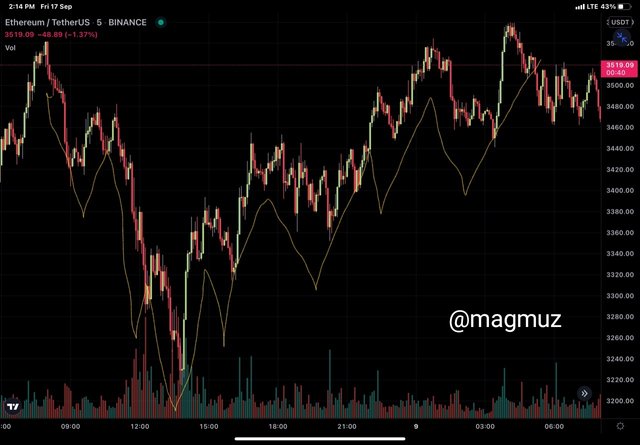
Screenshot from my tradingview app
We can see in the screenshot above at a glance the price movement of ETH over set time frame. We can see that price moving down in a zig zag manner followed by zig zag up movement of price.
In your own words, explain why the Japanese Candlestick chart is mostly used by traders.
Japanese candlesticks charts are most widely used type of charts. I think following reasons are responsible for widespread use of Japanese candlesticks:
They are easy to understand. Even without having indepth knowledge of charts, one can interpret candlesticks.
Candlessticks provide information regarding various trading parameters like open and close price, high and low price. Candlesticks are more informative than most of the other types of charts.
Candlesticks provide information regarding current price, past price and also help in predicting future movement of price.They also help traders easily understand trends.
When used in concordance with technical indicators, they are best type of charts.
Describe a bullish candle and a bearish candle identifying its anatomy? (Screenshot is required)
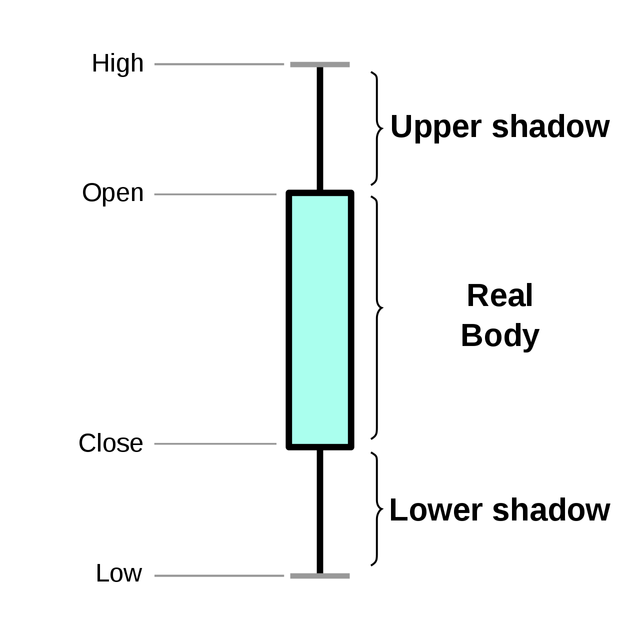
Anatomy of candle
Each candle has four price points and they are opening price, closing price, high and low . The area of the candle between the opening and closing price represent the real body of the candle. The price points above the the opening price and below the closing price are known as the wicks or shoulders of the candle. The price point above the opening price represents the "highest price" made by an asset during a particular time frame and the price point below the closing price represents the "lowest price" made by an asset during a particular time frame in case of bullish candle . The difference between top of an upper shadow to the bottom of lower Shadow represents the price range of an asset for a particular time frame.
Bullish Candle
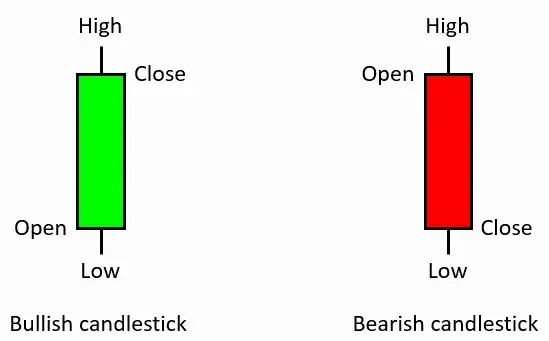
Bullish candle or green candle or white candle refers to a type of candle where closing price is higher than opening price. It means that the final control over the asset represented in candlestick is taken by buyers. In a bullish candle, lower side of candle represnt the opening price and upper side represent closing price.
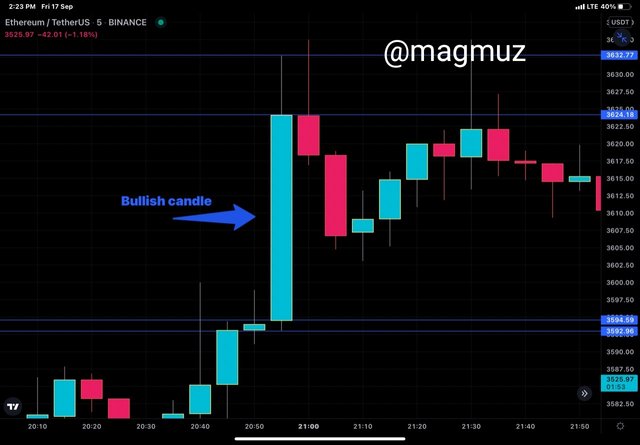
Screenshot or bullish candle taken from my tradingview
Look at screenshot of ETH/USDT . It is set over 5 min time frame . ETH opened at 3594.59USDT priice and has made high of 3632.77 USDT and low of 3592.96 USDT but finally closed at 3624.18USDT. So the price range of ETH over set time frame would be 3632.77 - 3592.96 USDT = 39.81USDT.
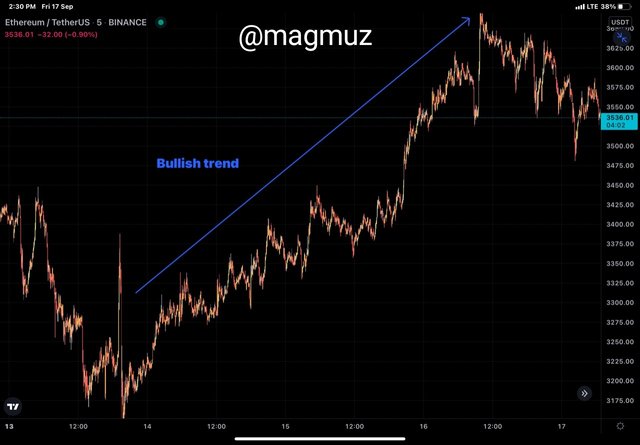
Screenshot taken from tradingview showing bullish trend
If price of an asset goes up over a particular time frame, it means the market is in bullish trend or uptrend. It indicates that the Buyers dominate the market.
Bearish Candle
Bearish candle or red candle is a type of candle where closing price is lower than opening price. It means that sellers dominate the market. In bearish candle, lower side of body of candle represents closing price and upper side represents opening price.
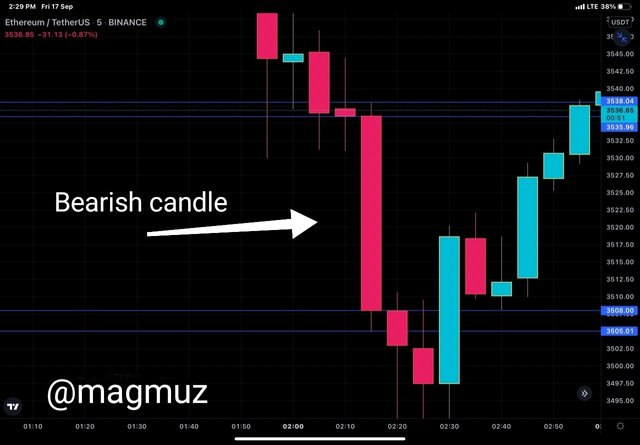
Screenshot to highlight Bearish candle
In the screenshot above, we see that ETH opened at 3535.96USDT and made a high of 3538.04USDT , low of 3505.01USDT amd closed at USDT 3500 So price ramge is about 33.03 USDT lower than opening price over set time period.
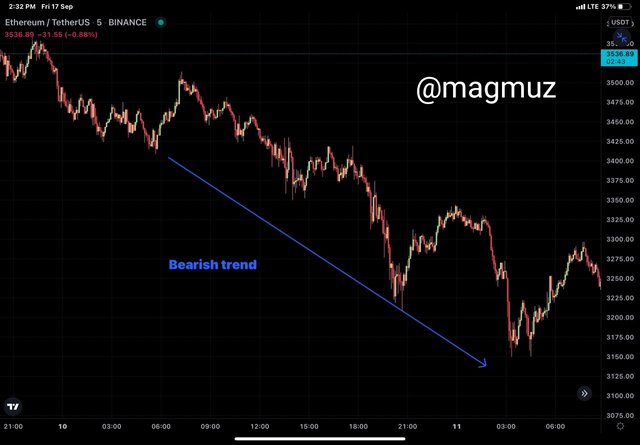
Screenshot taken from trading view showing bearish trend
If price of an asset goes down over a particular time frame than that is known as bearish trend or downtrend. It means that sellers dominate the market.
Conclusion .
Candlestick charts are basic and fundamental tools to help traders understand trading market and thereby perform different trading operations. Being comprehensive and simple, candlestick charts are most commonly and widely adopted charts in trading world.
Link to the original post
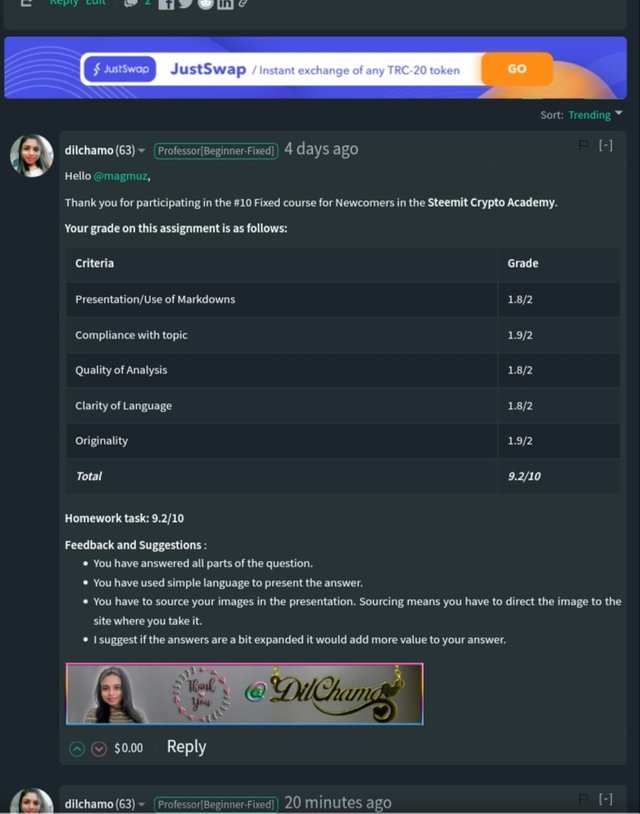
Marks of the original post - 9.2
Thanks
@dilchamo
Noted