How To: Read Standard Candles
Hello, and good morning/evening/afternoon/night everyone!
This will be the first post in The Magick School series and is also the first main lesson plan covered in my server on Discord which you can find the link to here: https://discord.gg/SgVxgfj or in my profile as the website link.
In this lesson we will be covering how to read and interpret the standard type of candles that you see when you are viewing a chart.
There are many different types of candles you can use when doing technical analysis, but we will start with the basics first to get you started on a good foundation.
So, without further ado, let's get cracking! :)
This is the basics of the basics when it comes to reading a chart, so other than learning something like trading or investing terminology this is the first thing that you should learn how to do.
If you can't read a candle, then most likely all the indicators and charting tools in the world might not save you from missing a target or making a bad trade.
First, let's go over the basic candle structure. Let's start with a green or "bull" candle
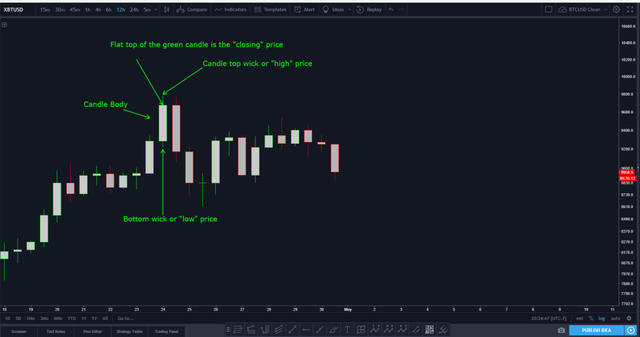
I posted a quick example of one, but let's go over it anyway.
The center of the candle, the solid green area, is known as the candle "body".
This area shows you how much the prices have changed on average for the amount of time that the candle was open.
A long body candle shows that prices changed a lot within that time frame and a small candle shows that they didn't change very much.
The next part of the candle you should pay attention to is the "wick".
There are two potential wicks on a candle.
The top wick and the bottom wick.
The top wick is the highest price that an asset reached for that time period.
The low wick is the lowest price that an asset reached for that time period.
Then, for a green candle, the flat top of the body is the "closing" price, or the price of the asset at the point that the candle time expired.
The flat bottom of the candle body is the "opening" price, or the starting price for the asset when the candle time started.
The same structure applies to red "bear" candles, except the only difference is that the flat bottom of the candle is the closing price instead since the prices were going down and the flat top is the opening price.
So, now that you know the basic candle structure, what does that structure tell you about a trend?
Well, there are a few very basic concepts to keep in mind.
The first is that the longer a candle is and the smaller the wicks are, the stronger the trend is in either direction.
So if you have a very long green candle body with either no wicks or very small wicks, then you have a very strong uptrend.
The reverse is true for a red candle.
Long red candle with small wicks or no wicks is a strong downtrend.
This basically tells you the "momentum" of a trend, or how far the trend is likely to go.
When you start seeing smaller and smaller candles, or if you start to see candles of the opposite color showing up in a trend while the candles you are watching are getting smaller, that means that trend momentum is likely slowing down.
With crypto it's a bit harder than that though.
With crypto as volatile as it is, sometimes the candles are not always a solid color going all the way up a trend, and you may see a lot of smaller candles or candles of the opposite color popping up all throughout the trend, so just using candle size and position isn't always a perfect indication of a possible reversal.
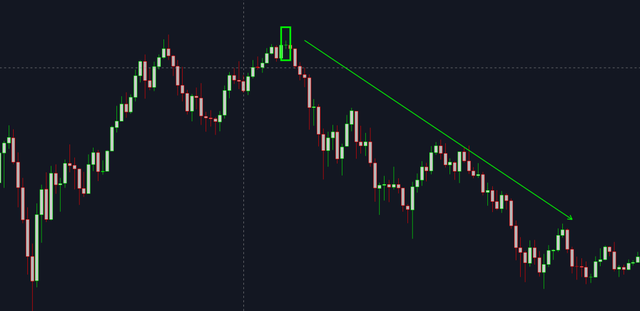
Just looking at this example, using that information, you would probably think that there was significant resistance to a downtrend and that if prices did go down, then they wouldn't go down very far right?
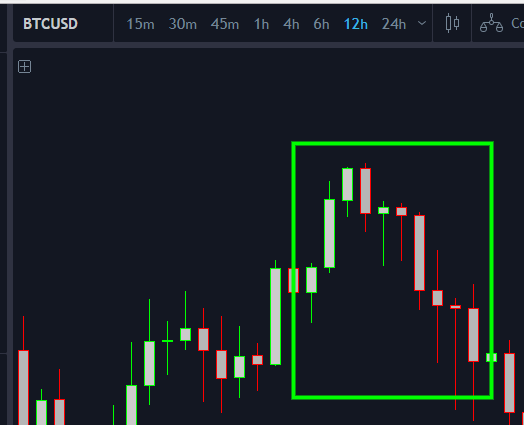
I mean, we already have a candle of the opposite color appearing with a long lower wick, the following red candles are not very strong with small bodies, and the trend doesn't seem very solid, right?
Well.......
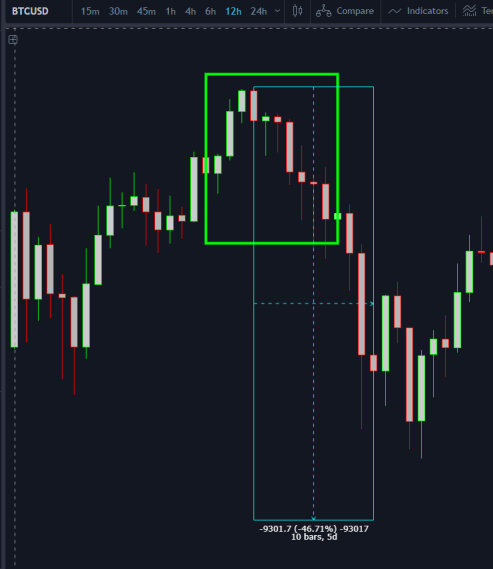
It still turned out to be a pretty big drop in price.
So, really, you can't only depend on the size of the candle or the wicks to give you a solid indication of the overall trend.
You can still get a lot of odd candles on the way up or down.
So what else is there to know about basic candles that can help you make a trade if the candle length and the wicks don't always show you the whole story?
Well, that is where advanced candle reading comes in.
There are all kinds of different candles out there that you can learn. Probably too many for us to cover here, and mostly because I don't take the time to learn every single possible pattern there is either. It's a lot, btw.
There are literally dozens, if not hundreds, of them you can learn, but there are easier ways to learn to trade then learning all those patterns.
But there are a few basic ones you should know at least.
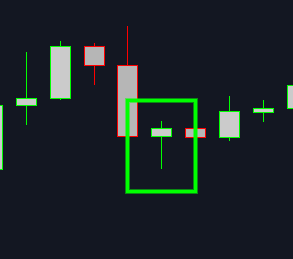
One of the most popular ones is called the Doji.
It looks like this:
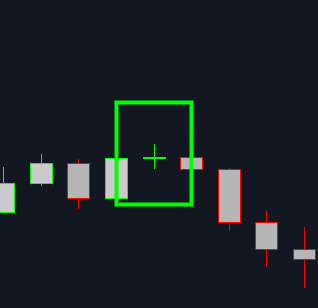
Looks just like a + symbol inside the square right? Almost like a targeting reticle?
Well, that's exactly what a doji is. Basically just a + sign.
What it essentially means is that there was indecision in the market. Neither the bulls nor the bears knew if they wanted the price to go up or down. Maybe it was a really hard fight. Maybe both were pushing hard but neither one won the battle.
A doji occurs when the opening price and the closing price of a candle are almost or exactly the same.
These candles "almost" always spell a potential reversal incoming at some point in the future, so traders usually keep a watchful eye out for them.
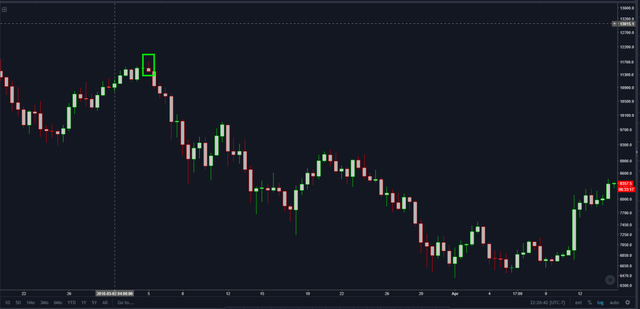
Which in this case......
Turned out to be a really good call. Literally the top of the market at the time before a new downtrend.
It doesn't always happen like that of course, but that one was a nearly perfect example.
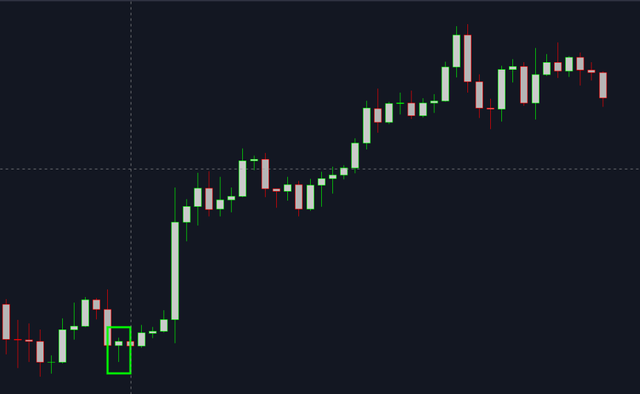
Another popular type of candle is called the "hammer" candle.
A hammer candle is pretty much exactly what it sounds like. It looks like a hammer. Easy, right?
This one basically means that the sellers tried to push prices down, but the buyers pushed prices back up into a solid block of support, preventing prices from dropping. This is usually a bullish sign.
And so it was:
There are two types of hammers. There are regular hammers, like the one shown above. Then there are inverted hammers. Pretty much the exact same thing, but upside down.
Which looks like this:

Inverted hammers usually mean a bearish reversal rather than a bullish one that the regular hammer shows.
You can combine candles to see if prices might be forming a trend, telling you a story of what is going on in the market currently.
In this case, even though you might not be able to see it very well because of the rectangle, you have a doji candle and an inverted hammer.
So, the story of this trend is we have indecision in the market and a strong sellers push down against the buyers. So that could indicate that the bulls are losing support and the bears are starting to take over.
And......
That's precisely what happened.
There are many many MANY other candle patterns like this that you can learn. Far too many to list here. Gravestone dojis, shooting stars, spinning tops, dragonfly dojis etc.
I will leave the rest up to you to research and read up on those various types of candles and what they can mean.
If you get good enough at candle reading, you may even be able to trade "plain", or without any indicators or charting tools at all. You could potentially trade just based on candles.
That's it on this lesson on candle reading for now. If you have any questions regarding this lesson please visit my Discord server, The Magick School.
We have this lesson and many others posted there, and each lesson has it's own QA channel attached so that you can ask questions about what you have learned.
Or you can go to the practice chart area to get feedback on your charts if you would like to try candle reading for yourself and find out if you are heading in the right direction with what you are applying to your charts.
Until the next post, good luck traders! :)
If you donate 1 SBD or STEEM to @a-a-a I will resteem your last post to over 72,500 followers on my 2 accounts @a-a-a and @a-0-0
Awesome post, logged in to Steam for the first time in a while just to bump it =) (and also to finally post).
Happy I followed everyone over from John's server, I really like what you are building there!