CRYPTO ACADEMY SEASON 4 [ADVANCED COURSE] WEEK 2: CRYPTO TRADING WITH VOLUME INDICATOR
Authored by @madridbg, via Power Point 2010, using public domain images. StockSnap
Greetings dear readers, back in the ring with another excellent lecture delivered by Professor @kouba01 in correspondence with week 2 of the fourth season of #SteemitCryptoAcademy, in which we will address what concerns trading based on the volume indicator. So let's get down to business.

CONCEPTUAL AND PRACTICAL ASPECTS OF THE APPROACHES PROVIDED BY THE PROFESSOR

In this section of the subject matter we will respond to each of the requests provided, which will allow us to generate a better understanding of the subject matter that concerns us and that we will describe below:
1. Explain the volume indicator in your own words.
At the level of technical analysis there are a variety of indicators that we can use to speculate the price action, so that under the learning obtained in each conference and according to my trading process, I can establish that there are three fundamental aspects that any trader should consider, referring to:
*The direction and strength of the market.
*Temporality of execution
*The volume or quantity of assets under trading.
Focusing our attention on the latter (trading volume), we can establish that it is an indicator that allows us to analyze the amounts of incoming and outgoing orders, which is known as orders traded in a period of time, so it is of utmost importance as it allows us to know or predict market activity, as well as the liquidity generated in this.
At chart level the volume indicator is usually used together with other indicators, it follows the behavior of the price action and is presented in the form of vertical bars, where the greater the amplitude of the bars the greater the interest or trading activity in the market, during a period of time, therefore, a low amplitude, indicates a lower amount of orders or activated trading.
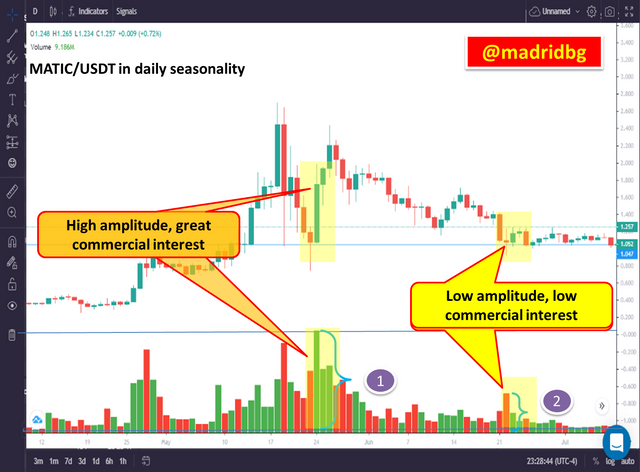
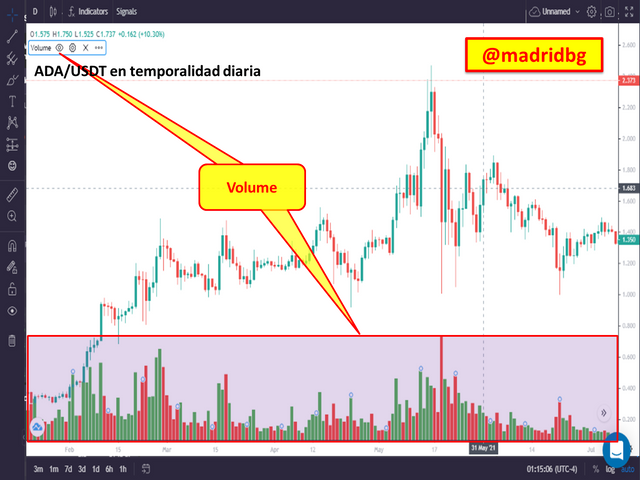
If we analyze the previous chart, for the MATIC/USDT in daily time frame, we can notice the presence of vertical lines associated with the volume, where the difference in size and color is visualized, so the larger bars, allow us to establish that a great commercial interest has been generated, so that the volume measures the intensity in the price movement and therefore, we can predict the direction of the same.
On the other hand, the red bars allow us to infer that the price of the asset in that candle closed lower than the previous candle, while the green bar shows us that the price has closed above the previous candle, valuable information for our speculative analysis.
2. Use a platform other than Tradingview to present the volume indicator on a chart and show how to set its parameters, justifying your choices.
To respond to these approaches we will rely on the free platform provided by bitsgap, and where we can perform our operations in practice mode, in this sense, we will configure the volume indicator on the platform, following the steps below.
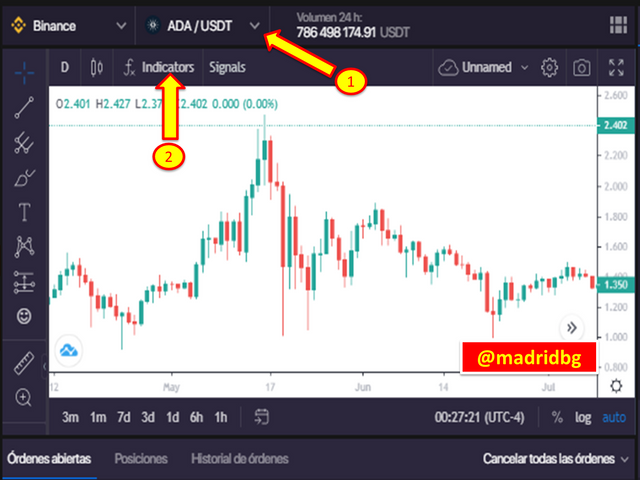
Step 1: Log in to the bitsgap website. Link
Step 2: Select the currency to analyze and then go to the indicators section.
Step 3: once the search option opens, type Volume (Pattern 2) and select the first option (Pattern 3).
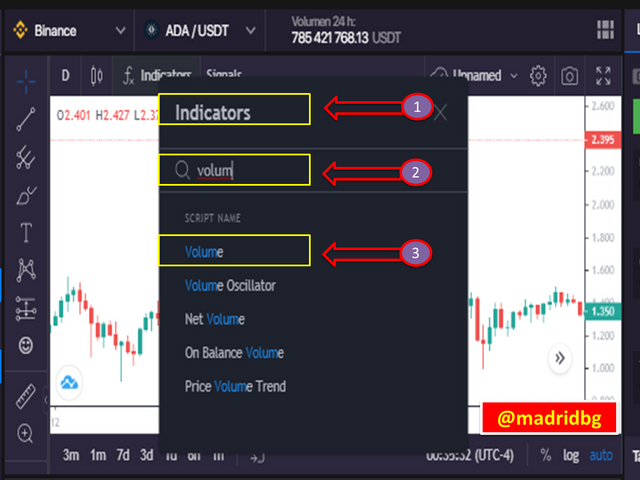
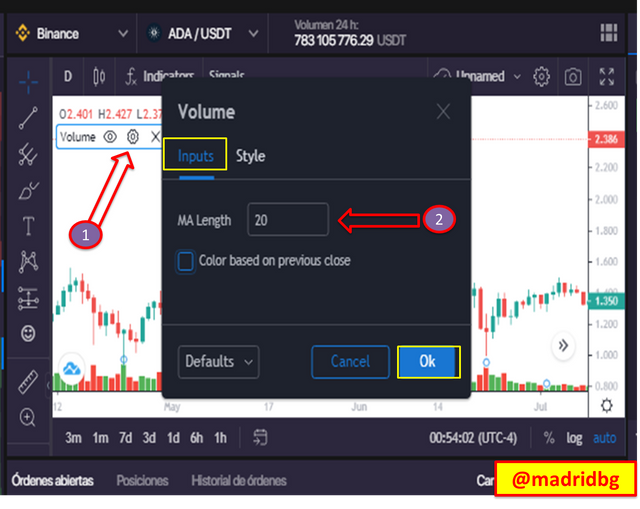
Step 4: To adapt the indicator to our trading style, we can go to the configuration section (pattern 1) and modify the data input (Pattern 2).
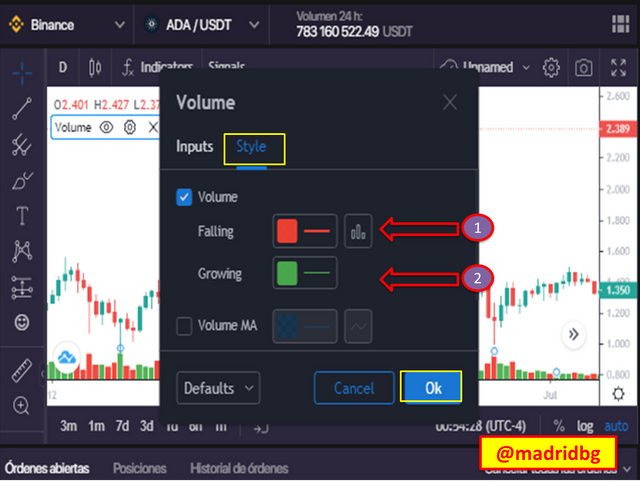
Step 5: If we want to modify the presentation of the indicator we can go to the style section and modify the color of the volume bars.
As we can see, they are very simple step that we can follow if we want to use and configure the volume indicator, for this particular configuration was made for the ADA/USDT pair in daily temporality, leaving by default the data in 20 periods, so we must assume that each bar of the indicator indicates the level of trading done in one day, and the period in 20, refers to the use of the last 20 days or bars within the indicator.
Similarly, we must remember that the platform used was bitsgap, primarily because it is free, intuitive and because it allows trading with fictitious money in practice mode.
3. What is the link between Volume and Trend and How to use volume to predict a trend change?
We will try to address these approaches separately, which will allow us to guide the reader through each process associated with the volume and trend generated, which we will describe below:
What is the link between Volume and Trend?
As mentioned above, volume allows us to determine the trading interest on an asset, as well as the extent of trades executed on it over a period of time.
Under this conception, volume is closely related to price movements, according to trends, since it precedes the price and consequently the following behaviors are to be expected:
1. When the trend is upward, the pressure exerted by buyers is increasing, a process that is glimpsed with bars of large amplitude and when this pressure decreases the amplitude of the bars also decreases.
2. When the trend is downward, the pressure exerted by selling investors is greater, so that the volume bars under this scenario increase in amplitude, and on the pullback it is to be expected that the selling pressure decreases, as well as the bars associated with volume.
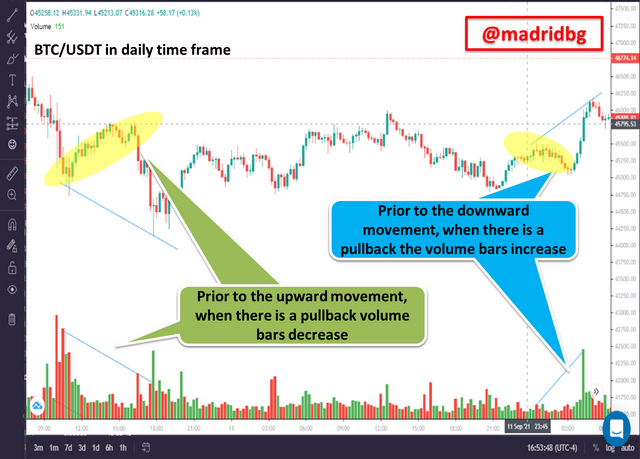
In one scenario or another, the volume indicator allows us to understand the action of an asset, so we can establish that the amplitude of the bullish or bearish bars is directly proportional to the direction of the trend, and inversely proportional to the retracements of the trend.
How to use volume to predict a trend change?
Previously we stipulated that volume precedes price, using this statement we can establish that a change in the amplitude of the bars in correspondence with the trend, is a strong sign of reversal, which we must take into account when performing our operations in the market.
Similarly the divergence that is formed between price and volume, are clear patterns to consider, understand divergences as the scenario that is generated when the price marks a rise and the volume indicator falls in number of buy and sell reversals and vice versa.
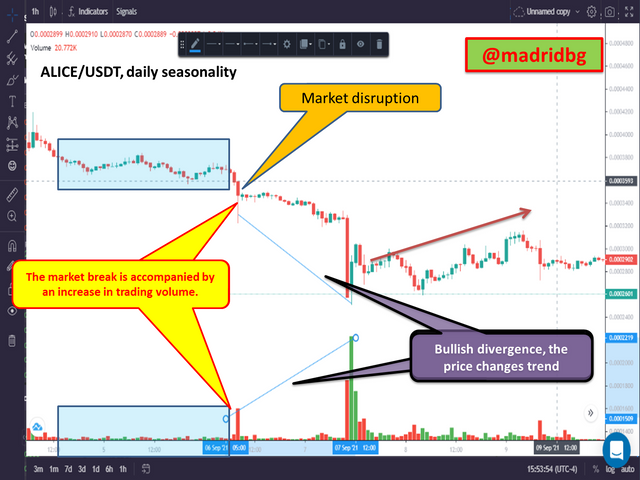
In this sense, a bullish divergence in a downtrend, allows us to think about a change of trend or strong correction of this one. For its part, a bearish divergence in full uptrend, allows us to speculate the price downward, generated a change of trend or correction in the action of the same.
Therefore, we must be clear that the volume is a reflection of the price and usually a change of trend or break of this, is accompanied by a large number of buying or selling on an asset in a period of time.
4. How to use the volume to have a signal confirmation?.
To answer this question we must learn to recognize the support and resistance zones and work according to them, so that the breaking of these zones is accompanied by a large flow of operations or orders of increasing activity in the market.
In this sense, the volume is a good indicator to decide to speculate in the market in buy or sell positions, for this we must consider the following aspects that will allow us to confirm the entry:
* Mark the support or resistance zones.
* Prior to the break or bounces in the above zones, evaluate the amplitude of the bars thrown by the volume, since these are the ones that delimit us the interest of an asset in a given period of time.
* If the amplitude of the bars, prior to the support or resistance zones is low, it is a sign of disinterest of investors in the asset, so we must handle with caution.
If we take the above aspects as a reference, we can find ourselves with two scenarios that we will describe below:
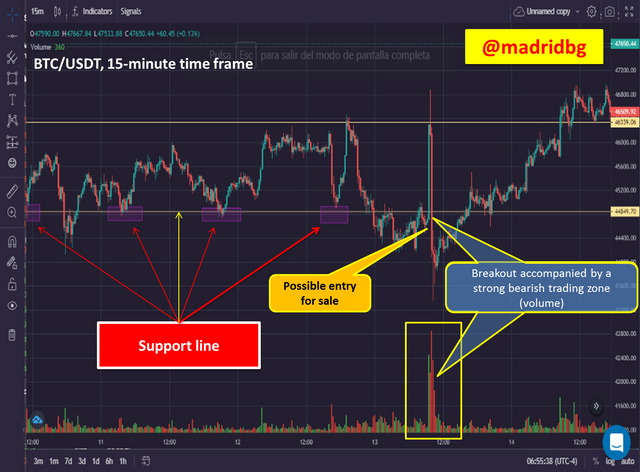
Scenario 1: signal in sell positions, the signal thrown by the Volume Indicator, manifests itself prior to the break of a support, the break comes because of the selling pressure, that is why, it is to be expected that the trading volume is strong which indicates a large amplitude in the red bars, which manifests us the possibility that the price can fall strongly.
As seen in the chart below, for BTC/USDT in 15 minutes timeframe, if we analyze it, we realize that the number of trades (volume) increased as the price approached the support zone, a signal that allows us to speculate on selling.
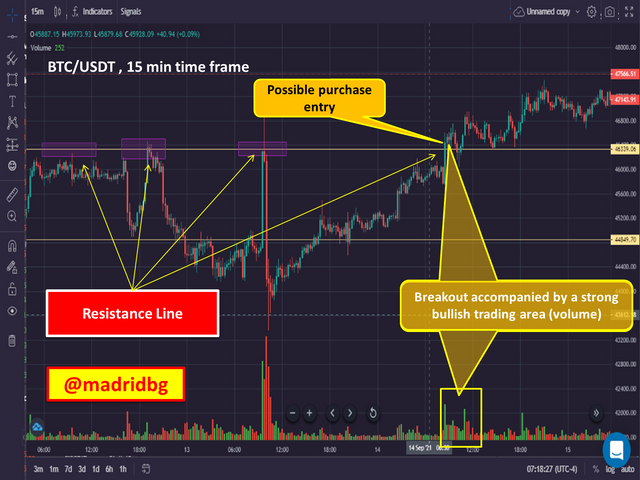
Scenario 2: signal on buy positions, the signal thrown by the Volume Indicator, manifests itself prior to the breakout of a resistance, the breakout comes because of the buying pressure, that is why, it is to be expected that the trading volume is strong which indicates a large amplitude in the green bars, which manifests us the possibility that the price can rise strongly.
As seen in the chart below, for BTC/USDT in 15 minutes timeframe, if we analyze it, we realize that the number of trades (volume) increased as the price approached the resistance zone, a signal that allows us to enter into buying.
Important note: there is a third scenario or signal that we can consider, which is assumed when the price enters in range or lateralization, where we rely on divergences and strong trading zones thrown by the volume, as a signal to enter into purchase or sale in an asset, so we will not go into detail as we explained it in the previous sections.
5. How does volume reflect price movements on charts and why does volume sometimes anticipate price?
As we have already mentioned, volume precedes price, therefore it is to be expected that sometimes volume will precede price action in a given asset, which is attributed to the buy and sell orders that have been programmed for a specific asset. In this sense, we will describe the approaches suggested by the professor separately.
How does the volume reflect the price evolution on the charts?
As we have mentioned in the previous sections the volume is an indicator that is managed in real time according to the temporality and period of time that we have configured, in this sense, the volume is a reflection of the price action and marks the evolution of the same according to the following aspects:
1. If the market is bullish, the price will generate larger peaks as it rises, an aspect that is reflected in the behavior of the volume indicator, due to the prevalence of orders or buying pressure.
2. If the market is bearish, it will generate lower and lower peaks and as a result the volume will reflect the same behavior, in this case due to selling pressure.
3. For market with low investment or low buy and sell zones, it is to be expected that the volume will remain with little intensity in the amplitude of the bars that it generates, due to the disinterest of investors on the asset in that period of time.
In other words, the trading volume or trading interest in an asset, allows us to determine or speculate on the price action of the asset, either bullish or bearish.
Why does volume sometimes anticipate price?
Again the answer to this type of approach has to do with the fact that volume precedes price, where we can find different scenarios, an example of this is represented by fundamental analysis or speculative news, where due to these a great buying or selling pressure is generated and the trading volume increases or decreases drastically, causing the price to delay in demonstrating this behavior product of the speed of the scenario presented.
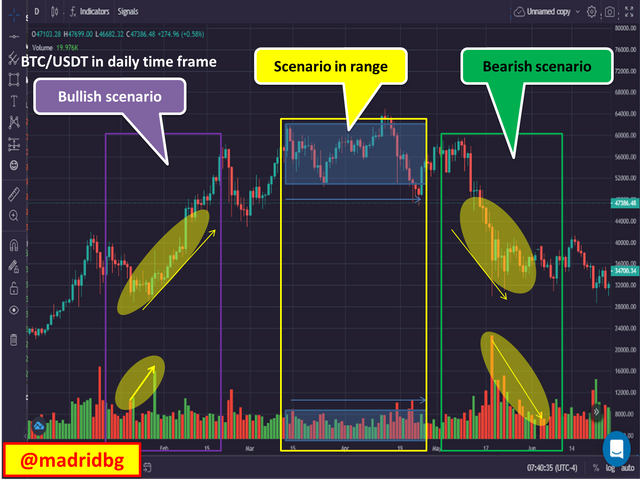
Other fundamental aspects of volume anticipation in relation to price have to do with the fact of trend behavior. For example, in a pronounced bullish or bearish tenure, high volume levels are observed in one direction or the other, however sometimes, in the midst of trend development the trading volume decreases drastically which allows us to infer in a strong correction is approaching and that is where the volume indicator has anticipated the price action.
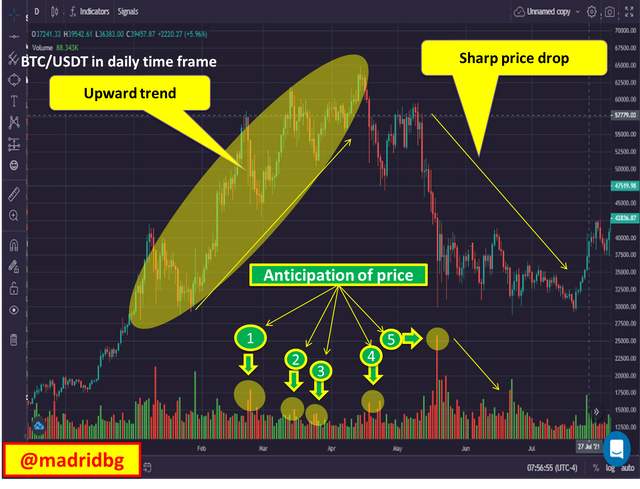
As we can see in the above chart, the market for the BTC/USDT pair in daily temporality, is in a clear uptrend, however, the predominant trading volume has mediated of the trend is bearish, which allows us to think that a major correction is approaching.
At this point, the volume anticipates the price on several occasions allowing the analyst to handle with caution before the scenario posed and as can be seen after 5 anticipation signals, the price drops drastically.
6. Is it better to use the volume indicator alone or to use it in parallel with another indicator when trading? Justify your answer.
It is no secret that technical analysis is based on the use of a strategy composed of several indicators, which allows us to generate a profitability above 60%, so that we can be efficient and profit from the market.
Based on the above, it is advisable to accompany the use of the volume indicator with other indicators that allow us to generate confirmations in the observed signals, according to my trading style I usually evaluate three fundamental aspects that make references to.
* Establish a temporality from higher to lower, i.e., analyze the price in high periods and mount orders in lower periods.
* Evaluate the direction and strength of the market, for this I rely on indicators such as MACD and ADX.
* Establish important trading zones, this is where volume plays a key role. So together these indicators form a strategy that suits our needs and trading style.
7. There are many volume indicators, choose one of them to briefly explain its usefulness in crypto trading.
To respond to this approach we will use as a reference the Net Volume Indicator, the same as a technical indicator is calculated based on the difference between the volume up and the volume down in a specific period of time, which allows us to predict the market sentiment either bullish or bearish.
Technically, this indicator gives us valuable information that we can use to evaluate the confidence in an asset, as well as determine the number of negotiations that is exerting greater pressure, so that positive values in it, induces us to think of a bullish rally, on the contrary negative values in this, does not manifest that the greatest pressure is being exerted by bearish investors.
As any indicator it is advisable to use it in conjunction with other indicators and evaluate its behavior according to our trading strategy, so that we can refine our entries and opportunities to capitalize on the market.
The net volume, allows us to open positions in buying or selling in areas of support and resistance, according to the price action and the number of operations or flow of money, which allows us to establish the strength of the market to break a support or resistance and therefore achieve capitalize our speculation.
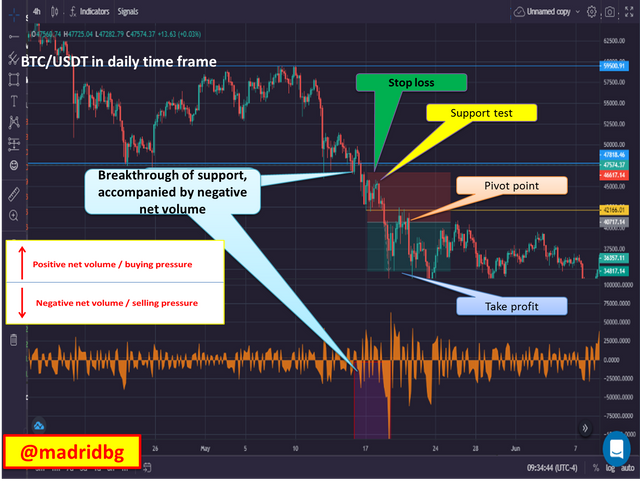
Net volume behavior as a function of price action: BTC/USDT pair 4-hour time frame
If we analyze the chart below, we realize that we have added the net volume indicator, which we can include in the chart by following the steps for adding standard volume (approach 2 of this paper), so that we have speculated according to the price action in areas close to the delimited support.
Once the support breakout occurs, we can observe that the predominant net volume zones is negative (below the zero point), so it is to be expected that the market has the strength to continue falling and we speculate downwards following the principles of the BRB strategy studied above.
So by doing a thorough analysis and accompanied by other indicators both the standard volume and the net volume, provide us with valuable information about the evolution of an asset as a function of time.
FINAL CONSIDERATIONS
As we have analyzed along these lines of writing, important trading zones (volume) where there has been a large confluence of buy and sell orders, allows us to determine the behavior of the price of an asset and speculate based on this.
In such a way that to manage and identify in the conceptual and practical, the aspects related to the volume, allows us to generate a more assertive analysis to capitalize when entering the market, hence the import of this conference driven by Professor @kouba from the space of #SteemitCryptoAcademy, where we can train ourselves in trading and go adapting our strategy based on the volume indicator, accompanied by other indicators that allow us to valid confirmations to the previously detected signals.
BIBLIOGRAPHIC MATERIAL CONSULTED
[1] Net Volume. Technical indicator rationale. Article: Online Access
OF INTEREST

#cryptoacademy #kouba-s4week2 #venezuela #steemexclusive #steemit #technicalanalysis #steemitcryptoacademy
Hi @madridbg
Thanks for participating in the Steemit Crypto Academy
Feedback
This is excellently done. Thanks for demonstrating your understanding of Trading with the Volume indicator.
Total| 10/10
Greetings Profersor @yohan2on thank you for the excellent assessment you make on my work, no doubt every week surprises us with new teachings that awaken our expectations. Greetings