Trading Crypto with On-Balance Volume Indicator - Crypto Academy / S5W3 - Homework Post for [@fredquantum]
Hello everyone, how are you all doing? I hope fine. So today, I invite you all to read my other homework, which is on Trading Crypto with On-Balance-Volume Indicator and given by one of the main and best professors of the #SteemitCryptoAcademy @fredquantum.
So let us get started.


Question no. 1
In your own words, explain your understanding of the On-Balance-Volume (OBV) Indicator.

On-Balance-Volume (OBV) Indicator is a technical momentum indicator that uses the Volume (which even confirms it by the Indicator's name) to show the market trend. The On Balance Volume indicator was developed in 1963 by Joseph Granville to see the trend of the stock prices.
On-Balance-Volume (OBV) Indicator shows the market trend, whether the market is going in uptrend or downtrend, by seeing the Volume. The Volume injected in the market shows the buy/sell moment to the traders.
The Joseph Granville believed that the Volume plays a key role in the movement of the prices of the assets. When the Volume of the Purchases/Buy in the market is high, then the asset prices will also go in the uptrend, as when many people will be buying the asset, the demand of the asset will automatically increase, so will the price too.
And if the Volume of the sell is high, then the asset prices will go into the downtrend. As it is a basic economics that when the demand is more than a supply, the price will go up and when the supply is more than a demand, then the prices will go down. So when the Volume of sell is high, the asset prices will decrease as the demand for the asset decreases.
So the On-Balance-Volume Indicator helps the traders see the Bearish/Bullish markets, a possible divergence, which helps the traders buy and sell the asset.
Question no. 2
Using any charting platform of choice, add On-Balance-Volume on the crypto chart.
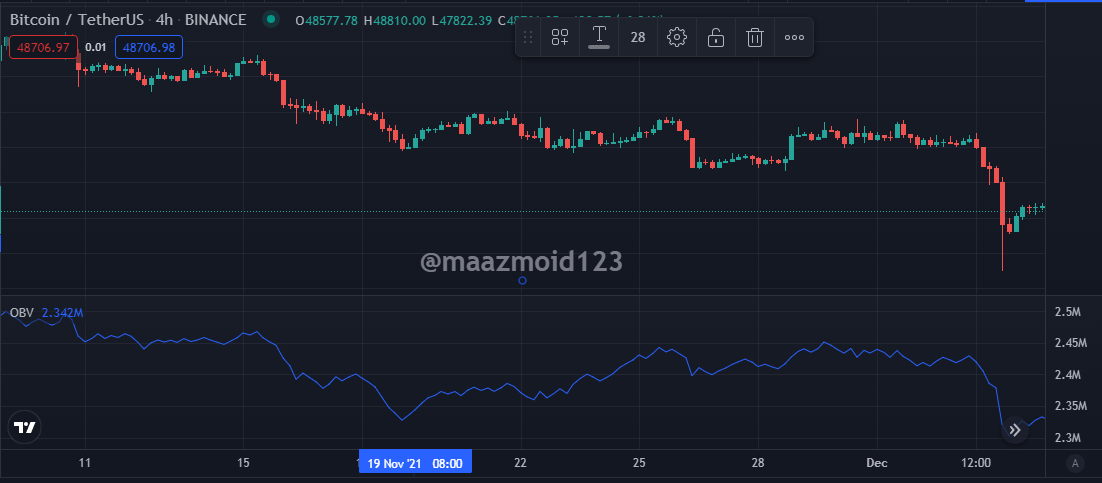
Now we will see how to add the On-Balance-Volume Indicator on the crypto chart.
Step 1: So firstly, we will enter the Tradingview, there we will click on the [charts], so a page will appear we will select the assets on which we will have to trade.

Step 2: Now the page is open where we can see a big chart and on it's we can see the prices and the tools we can use in the demonstration. While on the top, there are many different options such as, we can put the time frame of our choice, changing the candle styles, and put fundamental analytics. But here, we will choose the option of Fx [Indicator], as with the help of that option, we can add the Indicator in the chart.

Step 3: So after clicking on the [Fx - Indicator] option, a tab appears from where we can search the On balance Volume Indicator and select that Indicator, as you can see below.

Step 4: And now the balance volume indicator has been added to the chart. And now we use it to find the trends and do our trading.
Question no. 3
What are the Formulas and Rules for calculating On-Balance Indicator? Give an illustrative example.
From the beginning of the courses, we have studied many indicators, and in them, we have seen that there is some formula for that Indicator, which shows the path to the Indicator. So the OBV indicator also has a mathematical formula as it calculates the total volume of the asset and the present and previous closing day price.
- OBV = Previous OBV + Current Day’s Volume
The above is when the asset's closing price is higher than the previous day's close. - OBV = Previous OBV – Current Day’s Volume
The above is when the asset's closing price is lower than the previous day's close. - OBV = Previous OBV (+ 0)
The above is when the asset's closing price is Equal (=) to the previous day's close.
So now let see the illustration or the example:
| Day | Closing Price | Volume |
|---|---|---|
| 1 | $100 | 5000 |
| 2 | $150 | 7000 |
| 3 | $170 | 6800 |
| 4 | $120 | 5800 |
| 5 | $120 | 5500 |
So now if we see the calculation of the OBV from the data which is formed above, the outcome will be:
| Day | Previous OBV (+/-,0+) Current Day’s Volume | OBV |
|---|---|---|
| 1 | 0 + | 0 |
| 2 | 0 + 7000 | 7000 |
| 3 | 7000 + 6800 | 13800 |
| 4 | 13800 - 5800 | 8000 |
| 5 | 8000 | 8000 |
Question no .4
What is Trend Confirmation using On-Balance Volume Indicator? Show it on the crypto charts in both bullish and bearish directions.
For a trader, it is really important to understand the market trend, whether it is going up or down. As we know, that trend is an important thing for a trader to enter or exit the market. Trend guides the traders about if the market is going upward or downward, and by that, a trader makes his entry/exit in the market. So now we will see both Bullish and Bearish directions trends confirmed by On-Balance-Volume Indicator.
Bullish Trend

In the above chart of BTC/USDT, we can see the Bullish trend, clearly visible in the chart and the on-balance Indicator. On balance, the Indicator works by Volume of assets buying and selling. When the Volume increases in buying, the market goes into the uptrend. And also, in the uptrend, we can see that in the on-balance Indicator, it is making Higher highs and Higher lows. So that confirms the bullish trend, and because of that, we can guess that market will continue to go in the uptrend.
Bearish Trend

In the above chart of ADA/USDT, we can see the bearish trend visible in the chart and the on-balance Indicator. In the downtrend, we can see that it is making lower highs and lower lowsin the on-balance Indicator. So that confirms the bearish trend, and because of that, we can guess that market will continue to go in the downtrend.
Question no. 5
What's your understanding of Breakout Confirmation with On-Balance Volume Indicator? Show it on crypto charts, both bullish and bearish breakouts
Breakout is when the price of an asset goes our resistance or support levels. Consolidation in the asset price is one of the reasons for the Breakout. The on-balance volume indicator also helps the traders confirm the Breakout of the asset. So now below, we will see the breakout confirmation with On-Balance-Volume Indicator in both Bullish and Bearish Breakout.
Bullish Breakout

In the above chart of the ADA/USDT, we can see the Breakout of the asset in the chart and the On Balance Indicator. As here, we can see that the price was in consolidation for some time and was not crossing the support or resistance level, and then it broke the resistance, and we all witness the Bullish Breakout of the asset.
Brearish Breakout

In the above chart of the ADA/USDT, we can see that the price was consolidated for some time. Still, then we witnessed the change in the Volume, because of which the price broke the Support level we saw the Bearish Breakout. We can also confirm that with the On balance volume indicator, the OBV indicator also starts going downward with the price.
Question no. 6
Explain Advanced Breakout with On-Balance-Volume Indicator. Show it on crypto charts for both bullish and bearish.
Advanced Breakout is when the asset's price cannot break the previous high and previous low, and the on-balance Indicator breaks the previous high and previous low, and that thing made the advance breakout. We know that OBV works according to the Volume injected into the market. And in Advance breakout happens when the Volume is injected toward directions in the market.
Bullish Advance Breakout

In the above chart of ETH/USDT, we can see that the price was unable to break the previous high, and then we saw that the Volume was injected and the On balance Volume indicator show the advance breakout making the price of the asset go in the bullish trend.
Bearish Trend

Similarly, In the above chart of ETH/USDT, we can see that the price could not break the previous low. Then we saw that the volume reduction in the market and the On balance Volume indicator show the advance breakout, making the asset price go in the bearish trend.
Question no.7
Explain Bullish Divergence and Bearish Divergence with On-Balance Volume Indicator. Show both on charts.
As we already know, the divergence is when the asset price and the Indicator are going in the opposite direction. And the divergence warns the traders of the upcoming price movement or shows that the current price trend and movement are weakening. The divergence is of two kinds, the bullish divergence, and the bearish divergence, so we will see that divergence with the on-balance Indicator.
Bullish Divergence

In the above chart of BTC/USDT, we can see the bullish divergence as the price makes the lower high and lower low, while the on-balance volume indicator makes the higher high and higher low. The bullish in the OBV indicator shows the volume injection in the market, making the OBV show bullish in the market.
Bearish Divergence
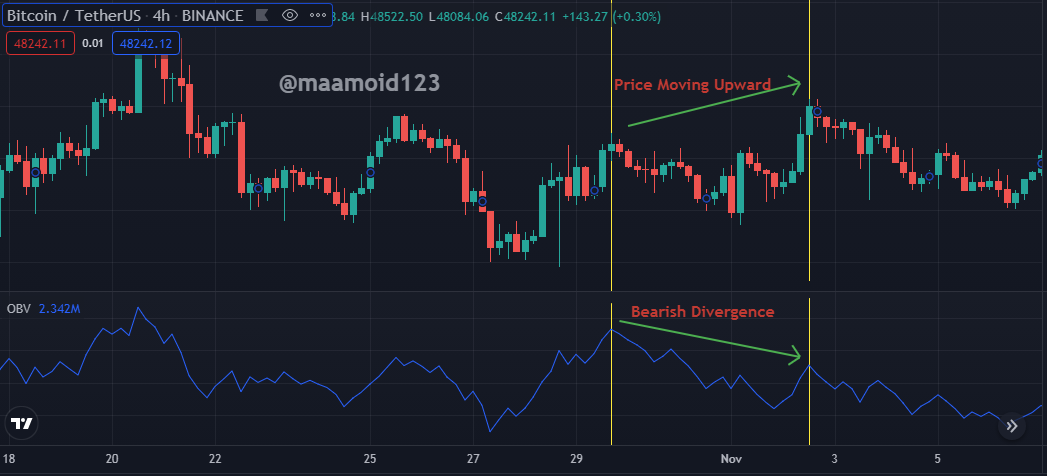
Similarly, in the above chart of BTC/USDT, we can see the bearish divergence as the price makes the higher high and higher low, while the on-balance volume indicator makes the lower high and lower low. The bearish in the OBV indicator shows the volume reduction in the market, making the OBV show the bearish in the market.
Question no. 8
Confirm a clear trend using the OBV indicator and combine another indicator of choice with it. Use the market structure to place at least two trades (one buy and one sell) through a demo account with proper trade management.
In this question, I will be using the Williams Alligator indicator with the OBV indicator to place my buy and sell trades.
Buy Trade

In the above chart of DOT/USDT, we can see that the price is going up in the uptrend and making the higher highs and higher lows, confirming the bullish trend. The OBV indicator also confirms this trend as we also can see the higher highs and higher lows in that OBV indicator which confirms the trend.
As well, we also have used the William Alligator Indicator, by which we also have confirmed the bullish trend as when the three lines Jaw, lips, and teeth cross each other and then the green line moves above making a little space with other two lines, so it confirms the bullish trend. And that's when we made our Buy Trade.
We can see that I have put the 1:2 (risk: rewards) ratio for the buy trade.

Sell Trade

In the above chart of XRP/USDT, we can see that the price is making the Lower highs and lower lows which confirms the bearish trend. And to confirm it more, we saw it on the OBV indicator, in which we also can see that it is also making lower lows and lower highs, confirming the bearish trend.
We also have used the William Alligator indicator to confirm our entry double, and there we saw that the three lines cross each other, and then the blue line goes above, making space with the green and red lines showing the bearish trend. So here we made our sell trade.
We have taken a 1:1 (risk: Reward) ratio for the sell trade.

Question no. 9
What are the advantages and disadvantages of On-Balance Volume Indicator?
| Advantages | Disadvantages |
|---|---|
| Easy and simple to use | It does not show the sudden manipulation of the market and whales. |
| Show the market trends, breakouts, and advance breakouts which helps in trading. | Using it standalone is risky, so it is advisable to use it with more indicators. |
| OBV Indicator can use it in both long-term and short-term trading. | Like any other indicator, we also can expect false signals. |
| Using it with some other indicator makes it better. |
OBV is a technical indicator that works according to the market's volume injection and volume reduction. When the volume increases, it will show the bullish trend, and the price will also start moving in uptrend and vice versa when the Volume decreases in the market.
It is an easy indicator, as a newbie can also learn and use it easily. On balance volume indicator helps the traders find the trends of the market, as well as the breakouts, advanced Breakout, and the possible divergence.
So now should have proper knowledge about the Indicator before starting to cut the possible risks in trading. So that was all from my side.
Regards,
@maazmoid123