Crypto Academy / Season 3 / Week 8 - Homework Post for [@cryptokraze] - Sharkfin Pattern
Hello Everyone, so today I invite you all to read today's Homework on Sharkfin Pattern subject which is given by Professor [@cryptokraze].
So let us continue with our homework.
SHARKFIN PATTERNS
We can see in the moving market when the prices are going up and down, and usually, it makes the reversal trends. And we can notice the price movements towards upward and downwards, and it usually then make a Sharkfin Patterns, or you can see it make a V Shape pattern. as when the price made a reverse we can see the V Shape and the Inverted V Shape.
- So here firstly below we have seen the V Shape, and we can see that is it made after the trend reversal, as the purple arrow is showing the downtrend and then it makes a V shape and it takes the uptrend which is shown by the orange arrow.
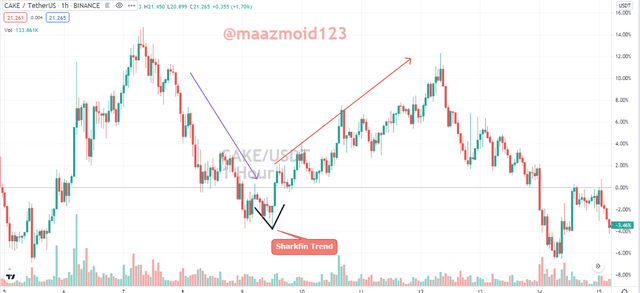
- And just like that we can see the inverted V shape, when the prices, were in the uptrend and then make a reversal and go towards the downtrend.
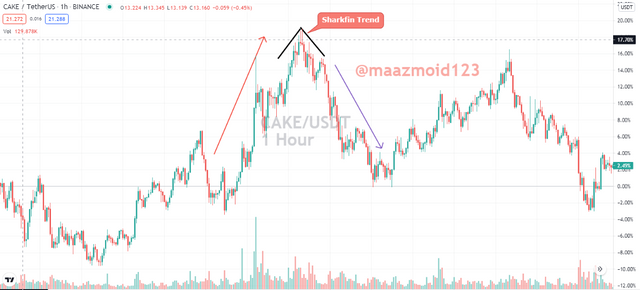
As we can spot the SHARKFIN from the charts, but how can we know that we have chosen the correct point of sharkfin to enter or exit the market? as we don't know much about the market, as the market can go in any direction.
So to encounter that issue we use indicators, to make a good outcome. And to spot that RSI (Relative Strenght Index) is the best indicator.
So we will take the setting of the RSI indicator on default, as in which the RSI length is 14 and the bands with 70 and 30.
Uptrend Reversal:
In the Uptrend Reversal, we will have to see that if the RSI goes above the 70 levels and then make a reversal, and move down the 70. That will give us the Inverted V pattern, in the chart as well as in the RSI Indicator and that will be a Sharkfin pattern.
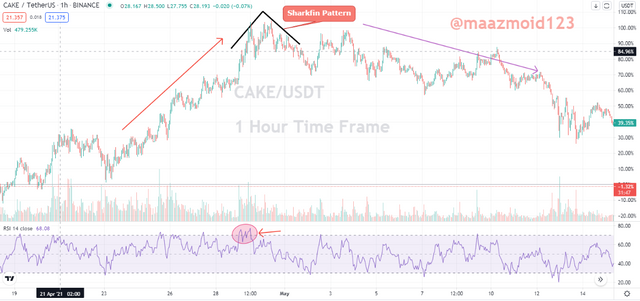
Here I have taken the asset of Cake/USDT and at the time frame of 1 hour. And you can see that the RSI also have confirmed the Sharkfin, as it goes above 70 and then moves downward to 70 making a reversal.
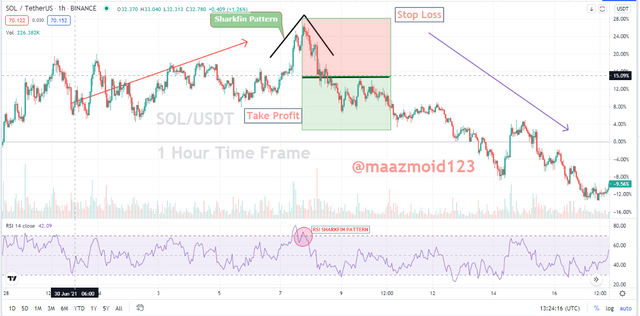
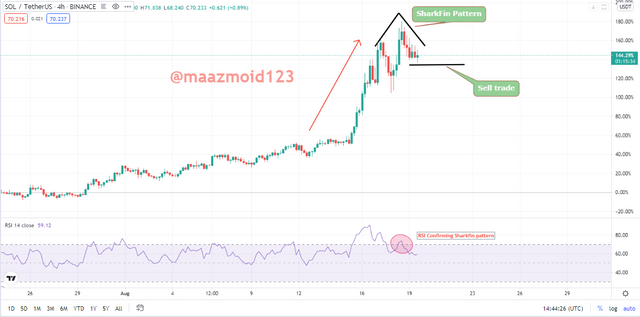
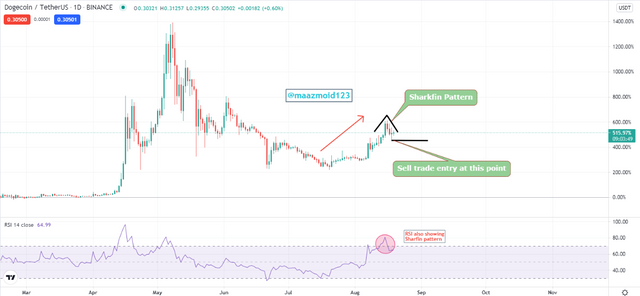
Downtrend Reversal:
In the Uptrend Reversal, we will have to see that if the RSI goes below the 30 levels and then make a reversal, and move above the 30. That will give us the V pattern, in the chart as well as in the RSI Indicator and that will be a Sharkfin pattern.
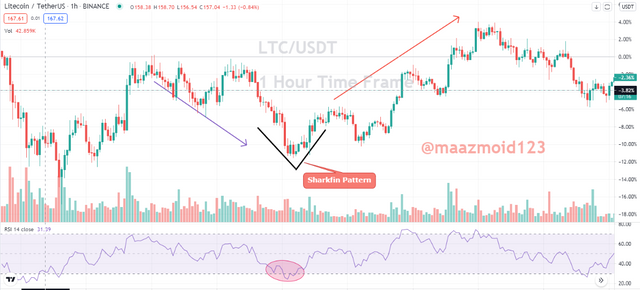
So here I choose the chart of LTC/USDT with the 1-hour time frame. And you can see that the RSI also has confirmed the Sharkfin, as it goes below the 30 and then moves upward from 30 making a reversal.
So we have learned about the trade using the Sharkfin pattern, but before jumping into the market, we all must know that what is the trade entry criteria, for both buy and sell in the market in the Sharkfin method.
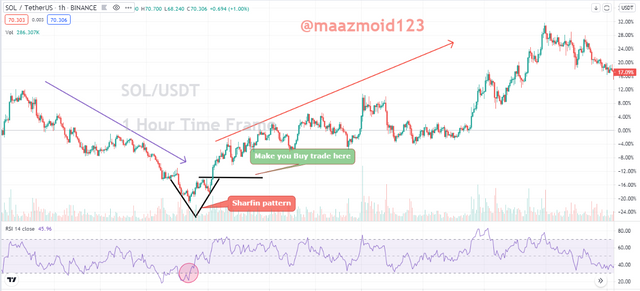
Trade Entry Criteria for Buy Position:
So firstly we will have to add the RSI indicator, at the default settings.
Then we have to wait for the correct time, we will see the market to make the reverse and make a V shape pattern.
We will have to see the RSI, we have to confirm or see that the RSI has gone below the 30 levels, then wait for it to make a reversal and make a V shape pattern.
And now finally place your order, when you see that the RSI is now above 30.
Note: must wait for some time to see clearly that the RSI is above 30, and then try to place an order, as usually while going up it can suddenly again go below the 30.
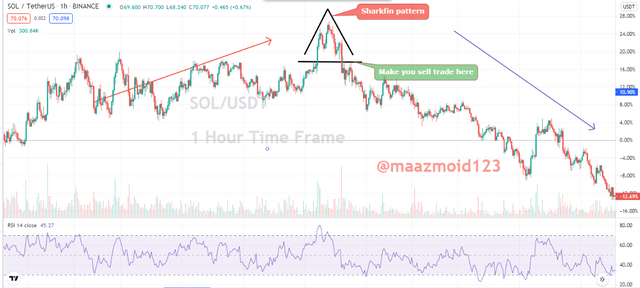
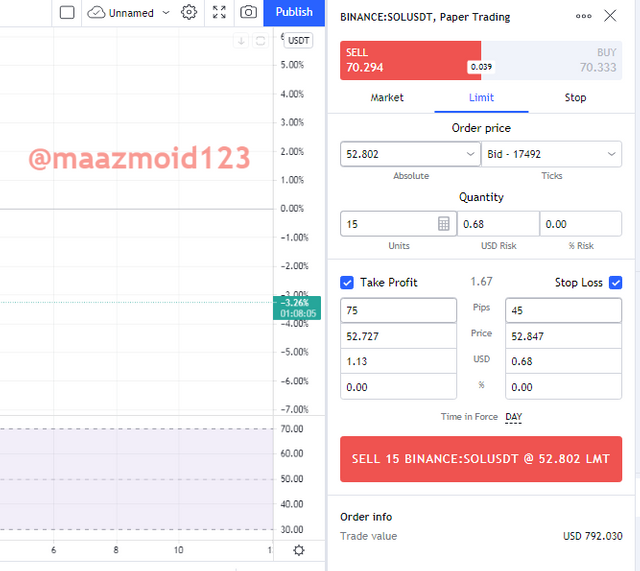
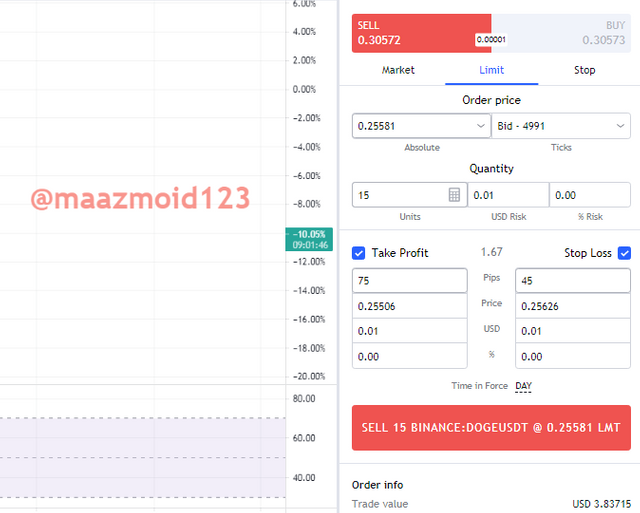
Trade Entry Criteria for Sell Position:
So firstly we will have to add the RSI indicator, at the default settings.
Then we have to wait for the correct time, we will see the market to make the inverted reverse and make a V shape pattern.
We will have to see the RSI, we have to confirm or see that the RSI has gone above the 70 levels, then wait for it to make a reversal and make an inverted V shape pattern.
And now finally place your order, when you see that the RSI is now below 70.
Note: must wait for some time to see clearly that the RSI is below 70 levels, and then try to place an order, as usually while going down it can suddenly again go above the 70 levels.
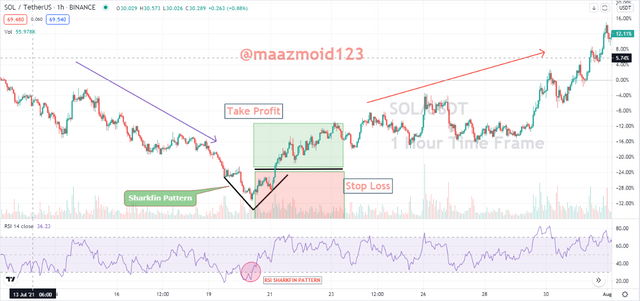
So for the Trade Exit Criteria, we must use the stop loss and the take profit levels.
Exit Criteria for Buy Trade Position:
We must set the stop loss level below the 30 levels, in case if the trade goes in the wrong direction.
And if the price of the asset, goes below the stop loss level, then we should stop our trade and then wait for another signal to enter into the market again.
If our trade goes in our desire direction or place, we then put the Take Profit Level also.
Then we will take the profit, the recommended level to take the profit is 1:1(Risk: Reward), while we also can go for the 1:2 or 1:3.
Now when the prices hit the profit level, then we can exit the market with the profits.
So for the Trade Exit Criteria, we must use the stop loss and the take profit levels.
Exit Criteria for sell Trade Position:
We must set the stop loss level above the swing low point, in case if the trade goes in the wrong direction.
And if the price of the asset, crosses the stop loss level, then we should stop our trade and then wait for another signal to enter into the market again.
If our trade goes in our desire direction or place, we then put the Take Profit Level also.
Then we will take the profit, the recommended level to take the profit is 1:1(Risk: Reward), while we also can go for the 1:2 or 1:3.
Now when the prices hit the profit level, then we can exit the market with the profits.


So like always today's lecture was also very informative and I have learned a lot, Today I see that what are SHARKFIN PATTERN, and how it got made? As when the price is going up or down and then make a reversal in the trend and make a V shape and Inverted V Shape are the Sharkfin patterns.
And we can make the best out of this pattern by using the RSI indicator with it, as it makes the signals more reliable. And to get the profits we can take the ratio of 1:1(Risk: Reward), but we can also go for more like 1:2 or 1:3.
So that was all from my side professor, @cryptokraze. I really enjoyed your lectures this season, I hope there will also be a season 4 and I will again get the opportunity to learn from you.
Regards,
@maazmoid123
@cryptokraze