RE: Mastering the Bull Run with Trailing Stop and Multi-Timeframe Analysis [UA/EN]
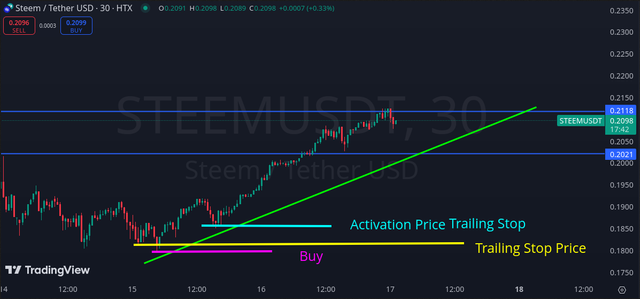
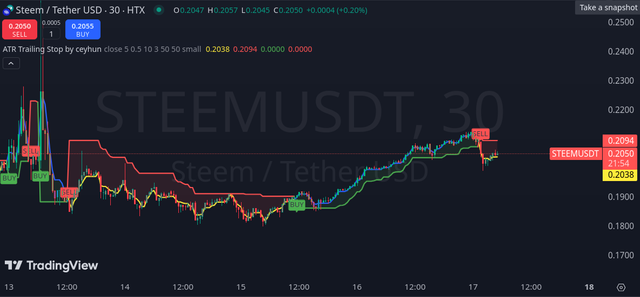
The 30m period has a smaller amplitude of volatility, and the comparative difference between the activation price and the Trailing Stop price is already around 60 points. This is the essence of setting the appropriate delta %, so that it corresponds to the time frames and corrective movements. That's it.
In short, just according to the direction on the higher TFs, look for entry points on the smaller TFs, where it is clearer and set real targets and accordingly fix the profit, move the stop losses.
Can Trailing Stop be adjusted?
The basic capabilities mentioned in this post do not allow adjusting the Trailing Stop, that is, its set parameters after placement, except in some cases to move it on the chart to the moment of activation by the price or delete and place it with the desired parameters. Another thing is the optimal and successful calculation of the Trailing Stop parameters depending on the time frame, as mentioned above. After all, each TF can form different or clearer intermediate signals, where the beginning and the probable end of the movement are better visible.
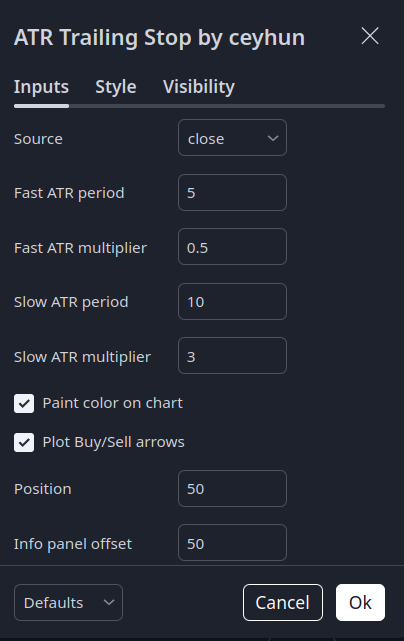
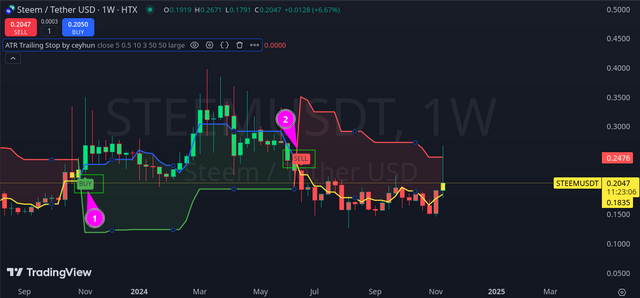
I will give another example, based on an indicator of ATR Trailing Stop made by someone, which highlights the areas where it is optimal to buy and where to sell. Factory settings.
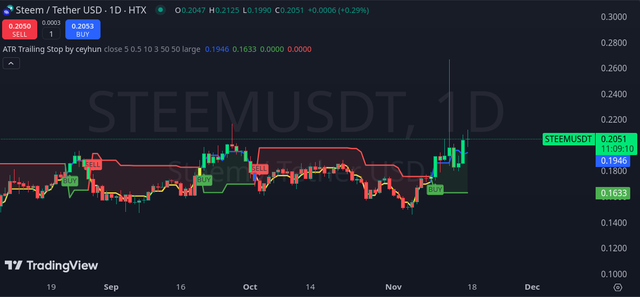
The W1 shows a very small interval between the purchase at 0.2060 1 and the sale at 0.2440 2, although the maximum is much higher, around 0.39. And there are no prospects for buying to accompany it.
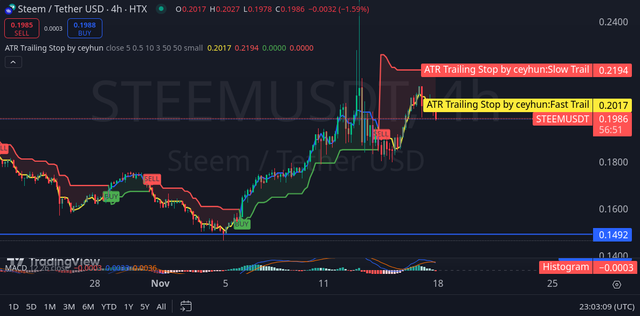
The D1 has the potential for growth from 0.17, but as we can see, the conditions for selling did not arise, that is, the trailing stop would not have been triggered despite such fluctuations, up to 0.25 and above, because they were short-term. And now it looks like the potential for further upward movement. The activation was late, you could have bought at a better price.
H4 reacts more accurately. That is, if this was algorithmic trading based on these parameters or manual support, then H4 would better cope with the movement, because the better price for buying is somewhere around 0.1550 (against 0.17 on D1) and selling in the area of 0.1930, although the sharp jump was not taken into account, because it was short-term, so in its absence it would have been almost perfect.
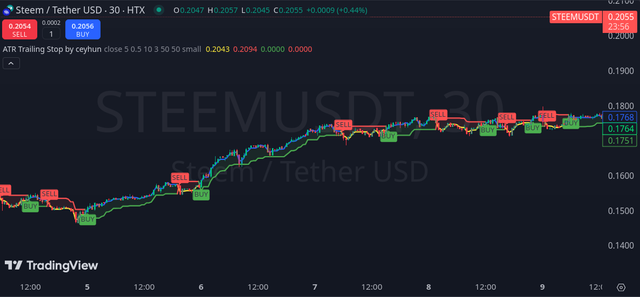
The 30m is even more sensitive to the price and the recommended ATR Trailing Stop indicators, which gives a better result in following the market movement, but also has significantly more of them, which can distract a little or load more. However, in the absence of a clear direction on the higher TFs, this significantly better protects the assets.
Conclusion
First, on the higher periods, it is better to take a larger Trailing Stop range if the direction is confirmed. That is, the percentage will be higher. And for smaller ones, when the situation is not clear, it is better to take a smaller delta percentage, so that there is better interaction with the price behavior. As well demonstrated on the 30m TF, because 5% there would be too much, and the benefit of such insurance would be much less.
Second, in the absence of signals on the higher TFs, on the smaller ones you can trade for a shorter distance and protect assets from depreciation using Trailing Stop. Catch the bullish wave in this way on the spot or feel freer on the futures.
Combining Trailig Stop
One Trailing Stop is good, but several are better. After all, you can combine them, or even set up an entire support grid, the main thing is to have the right calculation and enough deposit. So for improved profit optimization, you can add two trailing orders, for sale and purchase, but taking into account where the price is located.
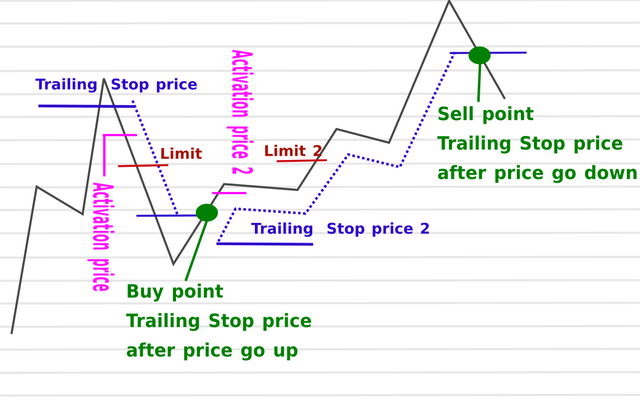
For example, a trailing stop on sale has been set during an uptrend. And in addition, you can add a purchase one, if there is a stronger decline. And the algorithm should be such that if the sale is triggered at the trailing stop price and there is a decline, then this will also allow you to buy the coins cheaper again. Because going straight from point A to B is one distance, and back and forth or a winding path with turns is another, and when it's several times, it's even greater.
Optimized Trading Strategy for a Bull Market with Trailing Stop
This is a standard trading strategy that requires analysis, but with the inclusion of a Trailing Stop for greater efficiency.
Trading Instrument: STEEM/USDT and others.
Time Frames: Any.
Analysis Tools:
- Trend lines;
- Support and resistance lines;
- Divergence;
- MACD for detecting divergence;
- Price Action bullish engulfing (optional);
- M & W reversal patterns;
- Multiple time frames of different sizes;
- Additional adjustment for fundamental news on cryptocurrencies in general and the direction of BTC price.
The Essence of the Strategy:
On the higher TFs, the main direction is determined, whether there is an overall trend. On this basis, there will be guidelines or prospects where the bulls can reach or where they cannot or will not go. Where a new bullish run can start. And if the higher TF does not have clear signals or does, it is still better to assess the situation on the lower TFs, where smaller patterns with a hint of the start of movement, its change, and the nearest targets may be. If the higher TF has long-term and medium-term prospects, then on the smaller ones, you can look for micro-trends without counting on long distances, so the targets will be closer.
To have more chances, the fundamental component and the situation with BTC (for this, you can add an indicator with its price on the chart for analysis) are taken into account.
More accurate confirmation of directions will be based on M & W reversal patterns, divergence, a simple Price Action model "Bullish Engulfing" and support and resistance levels. That is, for entry, at least two or three signs of confirmation are needed. The more, the better, but this will not always be the case.
This means that it is enough on strong support, a good base figure or reversal after a downtrend, and additionally the signal will be strengthened by divergence or bullish engulfing.
The Trailing Stop performs the function of optimizing risks and profits, so it will be instead of a stop loss (Sell Stop).
This is the basic principle, one example of an entry will be given below, but there can be many combinations.
Entry Point
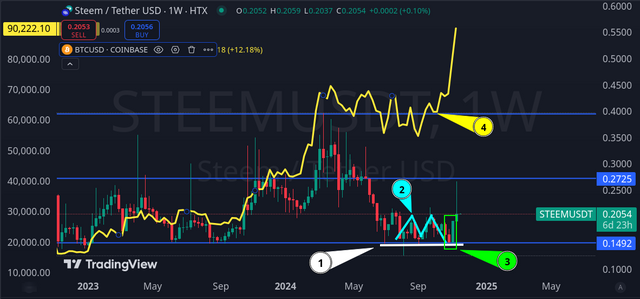
The W1 interval has strong support 1 at the lower boundary of the lateral channel. There, the M base 2 is also forming. Bitcoin has an upward trend 4 and is looking in the same direction (at the time of the historical example, it is correcting in anticipation of the US elections. At the elections, Trump wins, to which the cryptocurrency sector reacts positively, and BTC is climbing up). Bullish engulfing 3 will only appear later, but this is also a confirming signal to be able to get a piece of the pie. However, the main guidelines are within the lateral channel, then the top at 0.2725 is a strong resistance.
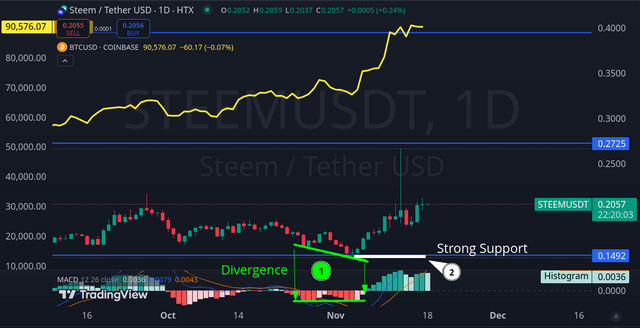
D1 from strong support 2 forms divergence 1, which strengthens the signal situation from W1, so that's good.
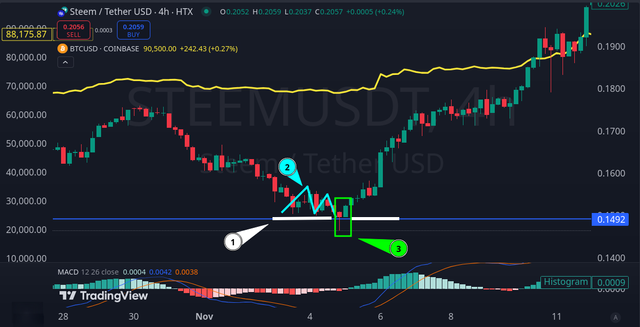
H4 confirms the higher periods and shows that you can no longer wait, because at support 1, there is a small M base and bullish engulfing 3 (although this is a pinbar). So you can start earlier.
Note: depending on the selected TF, the corresponding delta % will be selected, because at the time of the purchase and placement of the order Trailing Stop, it is not yet known how the price will behave, so W1 and D1, at the stage of bouncing off the support in the channel, are not very suitable (maybe only in my subjective opinion).
Comment:
Based on the analysis of the confirmation signals on all the selected time periods, H4 is the best for market entry and Sell Trailing Stop support. And the guideline is half of the main global channel and the upper boundary of the smaller one formed since the summer of 2024. So this is somewhere up to the 0.2070 resistance.
Buy: 0.1525.
Take Profit: 0.1950
Stop Loss: 0.1431
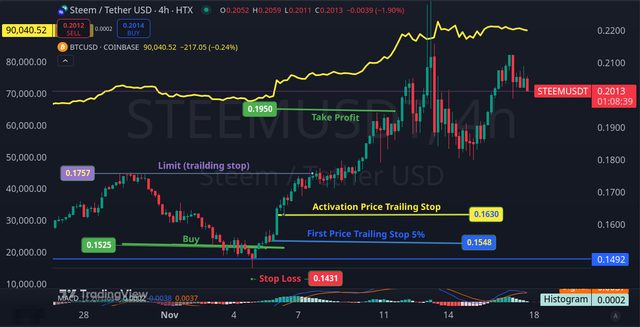
Trailing Stop Parameters:
- Activation Price - 0.1630;
- Delta - 5%;
- Limit - 0.1757.
Exit
Main Options:
- Reaching Take Profit;
- At the Trailing Stop limit price;
- At the Trailing Stop price.
Formation of signals, within the parameters of the strategy, for a change in the trend, for its long interruption, or something else important, such as a good Bitcoin retracement on the higher TFs.
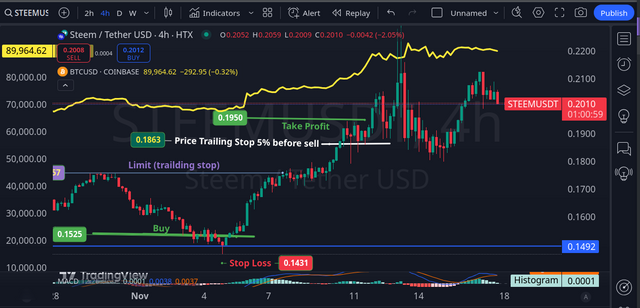
In this example, it is shown that the take profit was not reached, but the deal would have been closed at the trailing price of 0.1863 (if it had reacted in time). So this is a good result, because in real conditions, there would have been no information about a new high above 0.2650. Although if the delta calculation was higher, like for D1, the purchased coins would have been sold somewhere above 0.21 at the trailing price, but with higher risks in case of a deeper decline.
Limitations and Imperfections of Trailing Stop
Trailing Stop is primarily designed for moderate price movement support, if there is high volatility, it may not work properly, which is likely to lead to price range overshooting. Another negative point of this method is the possible premature triggering when a small delta percentage (Callback Rate on futures) is set, due to which the trailing stop price is pulled too close to the market price, and during corrective fluctuations, it will be triggered earlier than the bullish run is completed. Therefore, to prevent such cases, it is better to select the delta % according to analytical considerations regarding the forecast and time frame. On higher TFs, this can be a higher % (in points, respectively, too), because the formations are longer, and the patterns give a greater distance traveled. Smaller TFs, accordingly, should have a lower delta % to match the range of the uptrend and allow for corrective pullbacks.
Regarding the activation price, the distance from the market price should also be taken into account, so that there is a scent of movement for corrective movements.
Also, for a volatile market, it is better to choose a higher delta percentage to prevent premature activation, but this increases the risks. For a calm market, a lower delta % is better.
It is important to remember that Trailing Stop does not take into account time frames, so the order will work with the parameters that were set in advance. Therefore, it is recommended to calculate the delta % to price ratios according to the time when the most appropriate signals or forecasts are. If on D1 there are no more distant prospects, and on 30m there is a small bullish trend, then there is no point in setting a large delta %. The opposite is also true - a small one for large TFs, when there is a good trend there.
Another point. Trailing Stop works automatically on cryptocurrency exchanges, that is, it does not require constant Internet connection and operation of the trading terminal, as it is for other markets and types of trading. So for trading through the API, you need to find out the details of the functioning, because it may be that the trailing stop will not work when it is closed or disconnected from the Internet.
To correctly and more timely recognize and have significantly higher chances to prevent a trend reversal, you need to have basic theoretical knowledge and some practical experience in identifying reversal patterns, as these can be different variations and combinations of figures and indicator readings. Therefore, it is better to choose effective and understandable methods for yourself. For example, a combination of Bollinger Bands, M and W formations, as there is no point in describing everything. Because Trailing Stop is just a tool for improved asset protection and profit optimization compared to static limit orders. So it is in no way an element of analysis or trend recognition and does not relieve the need to conduct technical and fundamental analysis. It is just a useful addition to the execution of trading. However, it can be included in automated trading systems, for example with ATR as mentioned above in the post, and respond comprehensively to changes in direction, including the trend.
Sources, resources, materials used:
https://crypto-book.com.ua/bullran/https://coinmetro.com/learning-lab/analyzing-historical-bull-runshttps://www.investopedia.com/terms/a/atr.asphttps://www.youtube.com/watch?v=u8ITqAS_-78https://www.youtube.com/watch?v=QPyE36r-UqEhttps://www.coingecko.com/en/coins/steemhttps://www.tradingview.com/- In addition to my own images, the screenshots are taken from the websites mentioned above, they mostly contain logos and inscriptions, so nothing is hidden. The main image was generated by SDXL 1.0 and edited.
- Consultations and assistance from the AI, including translation into English.
#ukraine #cryptoacademy-s21w3 #s21w3 #club5050 #crypto #steem #usdt #bull
