5 COMMON INDICATORS USED IN TECHNICAL ANALYSIS
Good day everyone,
I'm delighted to be a member of this community and today I will writing on 5 common indicators used in technical analysis.

Technical indicators are mathematical tools developed with the aim of predicting market financial market direction. It is based on historical pride information such as previous volumes, previous price open and close, and other factors in predicting possible price direction.
These indicators are classified into leading and Lagging with the former being used mostly by scalpers and day traders while the latter is mostly used by swing traders.
Now let's look at the top 5 indicators used in technical analysis.
- RELATIVE STRENGTH INDEX (RSI)
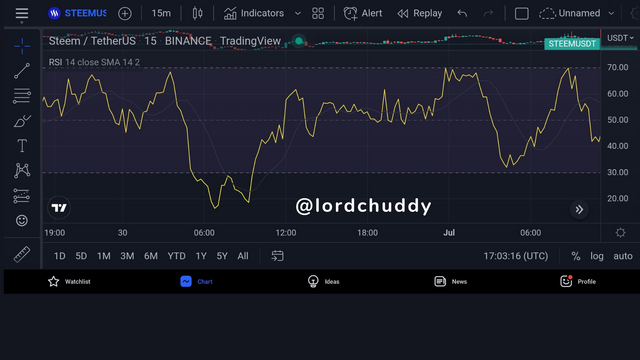
The Relative strength index indicator is a momentum based indicator that determines the weight of recent price changes. It is used primarily in identifying when an asset is either overbought or oversold which furthers tells technical analysts to get ready for a possible price reversal.
Its overbought and oversold regions are marked by 70 and 30 respectively. It is commonly used by traders and technical analysts in determining when a asset price momentum is changing.
- MOVING AVERAGES (MA)
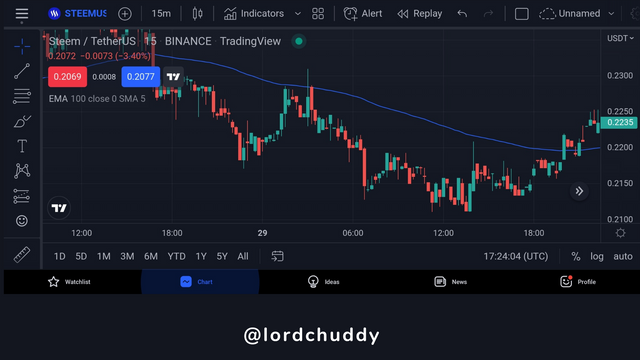
The moving average indicators are trend based indicators used by traders and technical anlayst in determining the over all pride direction. It does this by filtering out noises thereby making clear the actual market direction.
When a moving average indicator is trending above the price, it indicates a downtrend movement and when it is trending below the price it indicates an uptrend movement.
Also, the moving averages serve as dynamic support and resistance on the price chart by sometimes restricting prices from moving further up or down thus allowing traders to capitalize on their position when anticipating for a price reversal.
There are three common types of moving averages and they are;
🔺 Simple moving average
🔺Exponential moving average
🔺Smoothed moving average.
- MOVING AVERAGE CONVERGENCE DIVERGENCE (MACD)
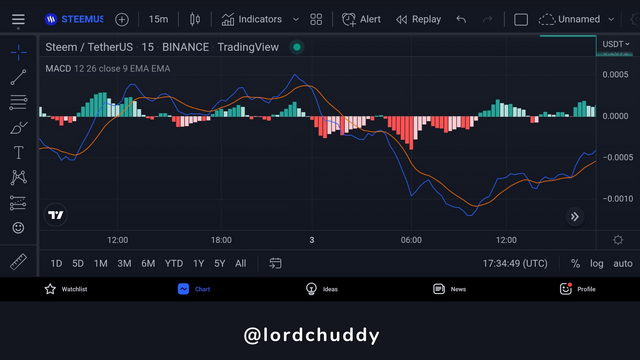
The MACD indicator is a momentum based indicator which is often used by traders in termining the level of assrt momentum in the market.
It is made up of two lines known as the MACD line and the signal line. It also shows relationship between two moving averages and can give out signal based on different patterns. For instance, it shows divergence by forming a pattern contrary to what the price is showing.
Let's say the price is forming a higher high and the MACD is forming a higher low. This shows a drop in momentum which indicates that the current price trend is weak and a possible reserval is expected.
The MACD indicator can also give out signal using crossovers. When the MACD line crosses above the signal line, it indicates a buy option and when it crosses below the signal line, it indicates a sell option.
- STOCHASTIC RSI
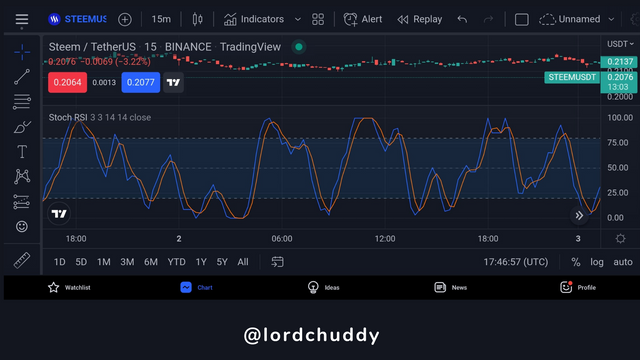
The stochastic indicator is a momentum based indicator. It is an oscillator which acts similar to the RSI in determining when an asset is overbought or oversold.
Slightly different from the normal RSI, the Stochastic oscillator's overbought and oversold regions are marked 80 and 20 respectively.
It is also used in spotting divergence on the price chart when it from a trend pattern contrary to that which is shown on the price chart.
- BOLLINGER BAND
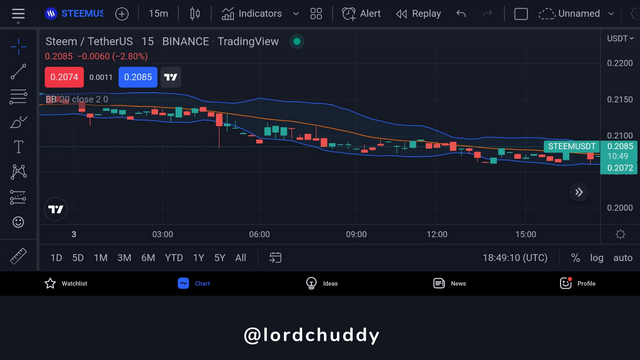
The Bollinger band is a volatility based indicator which also indicates when the price is oversold or overbought. It is made up of 3 SMAs known as upper, lower, and middle band. When the price moves towards the upper band, it is regarded as overbought and when it moves close to the lower band it is regarded as oversold.
In some cases, the price may move above or below the upper or lower band and a situation like that is regarded as extreme market condition.
In addition, the Bollinger band being a volatility based indicators shows the level of price volatility based on the distance between the upper and the lower band. When the distance is much, it is regarded as a high volatility market and when it is small, it is regarded as low volatility market.
Indicators are essential for traders and technical analysts as it saves them the stress and difficulty of manually tracking previous price behaviors. In as much as indicators helps in determining price behaviors and possible directions, it is not advisable to trade solely on signals provided by them as combination of indicators and price action technique will increase the probability of success.
10% to @Tron-Fan-Club
Tweet
https://twitter.com/Changeyouseekk/status/1543679845074362369?s=19
The indicators i love the most is Move Average Indicator and RIS. The other indicators are also very useful, you just have to learn how to use it to predict the market.
I like the the RSI more but no indicator is adviced to be solely used. Combing them is the best
Thank you very much for this valuable detail of 5 common and important indicators. This is very useful for all the crypto traders in this community. Keep doing such valuable articles here.
Thank you my friend.
Your comment is well received
You are most welcome my friend. Keep writing such interesting article in this community.
what an amazing sight you show here and everyone will be able to learn from your mistakes
Thank you