BITCOIN 4hr Chart Daily Analysis 04/04/2020
Hello Steemit family,
This is is my daily chart analysis on Bitcoin in the 4h chart timeframe.
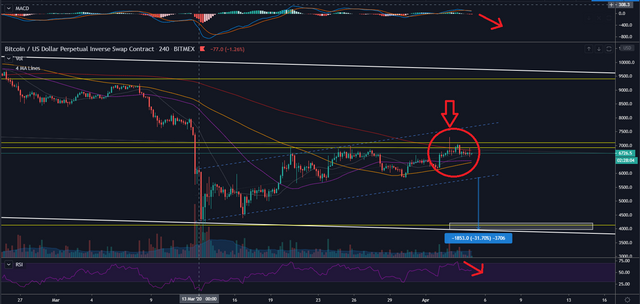
As we can all see, the bulls and bears are really fighting hard with each other on who is gonna dominate in this strong key resistance area.
We can see in the red circle that there is already a long wick that is printed meaning there are really a lot of bears that are willing to sell in those areas.
We will need a lot more volume and bulls to overcome this quite big resistance. Especially the fact that we are still having the current issue on the corona virus crisis.
In technical perspective also, we can see that the Moving Averages are still pointing down, The RSI is also in the overbought area and the MACD seems like it is already pointing downwards. This indicators really mean some bearish scenario is brewing.
But still, anything can happen so it is good to be ready whichever Bitcoin may go.
This is not an investment advice and for educational purposes only.
These are only my opinion and you are free what to do with these knowledge.
Trading/Investing have inherent risk involved and should be handled with proper risk management.
Till next time guys,
Cheers!!
Stay safe always!! :-)