Understanding Charts types and their peculiarities(Part 1) || 10% to tron-fan-club
Hello,it's good to be back again to share with us all another informative and educative content of mine. Today we will be looking at some common and viable chart.

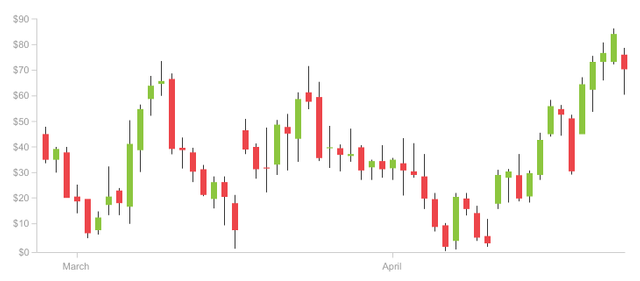
Candlestick Chart is a chart that has been widely accepted by many traders due to the way it present it information which help trader determine their next line of action. It was founded by a Japanese rice famer by the name Homma.
Candlestick chart is a chart that is made up of several candles which helps in determining price action and this is possible because the opening and closing price at a given period is shown coupled with the highest and the lowest point of market price at a given period of time.
Candlestick can help trader identify trend, trend continuation,reversals including entry and exit points in the market.
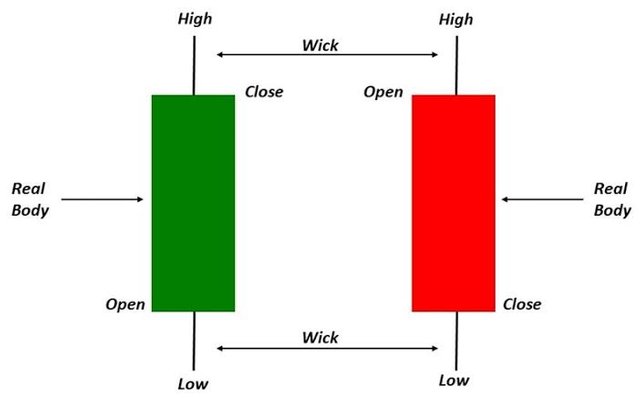
Open Price: The opening price just as the name implies means the price at which an asset starts trading with (opened) during the formation of a new candle. If it price rises and moves upward,the candle turns green or your defined colour depending on what your setting is and if otherwise,it turns red.
High price: high signifies the highest price an asset traded at a given period of time. If that price is not sustained,a wick is formed and in a case where there is no wick,the open or closing price is said to be the highest price that asset was traded in a given period of time.
Low Price: Low signifies the lowest price an asset traded at a particular period of time,a wick is formed at that point if the price is not sustained there.
Close Price:
The close price just as the name implies is the very last price an asset traded in a particular period of a candle's formation. Now if the candle closes below the price it opened with,the candle will appear red but if otherwise it appears green or whatever colour you choose via your setting.
The Wick/ Shadow: The wick or shadow is another important element in the anatomy of a candle. It show the highest or the lowest point price got to in the course of a candle formation. It is easy to identify just as seen in our image above
Note: kindly bear in mind that each candle represent the price movement for a particular period and that period can be determine by you. You could decide to set each candle formation for 30Min, 1Hhr or even 1 Day/ 24Hhrs
Bar chart is one of the prominent chart trader use in their trading adventure. It helps traders in monitoring trends, movement and volatility. Bar chart operate by showing what we refer to as OHLC which mean Opening, High, Low and Closing price of an asset or security at a particular period of time. Like I mentioned earlier, Bar chart can help trader see the level of volatility of an asset in a given period of time and by volatility,I mean the difference or change that has occured between the high and the low.
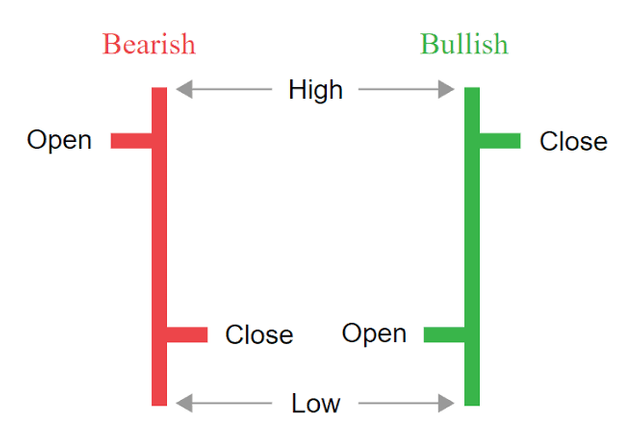
Vertical line :The vertical line in this image indicates the high and the low prices in a particular period
Horizontal line (left) : The horizontal line on the left side indicates the opening price
Horizontal line (right): The horizontal line on the left side indicates the closing price.
Note: In using bar chart when the opening price of an asset in the market fall below the closing price the bar chart will appear green or balck indicating gain or bullish and if otherwise,it will appear red indicating loss or bearish mode
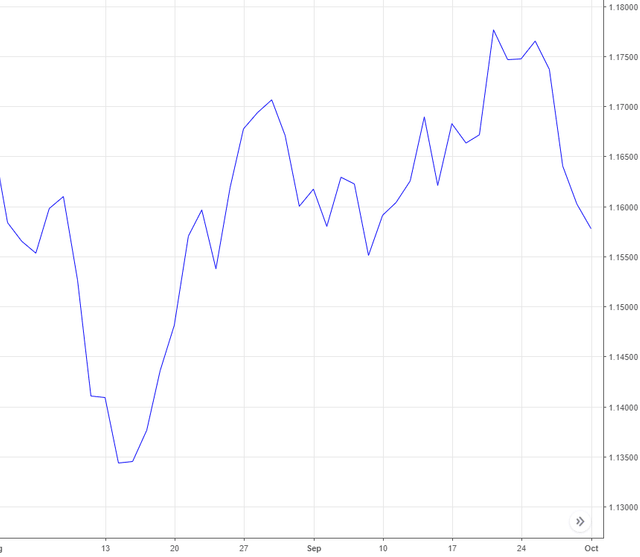
Line chart seems to be the simplest kind of chart in the list. What this chart does is to give you a graphical insight of price and the changes that have occurred over time using only the closing price of the asset on a continuous line without any form of breakage.
This chart is simple to understand because it only display the closing price of an asset which had in a way reduce the noise in the market. It eliminate the open,high and low price in the market.
Traders that love details avoid line chart because it's deficient when it comes to giving sufficient details for wise investment decision.
We have been able to explore the top and prominent chart used by trader and their peculiarities. As a good trader or investor,you will need to carry out your own research and choose the one that suit your trading activities. Not all will definitely suit you and that's why am leaving you with a choice to choose what suits you. You can as well explore other type of chart not mention here. Thanks for staying up till this point.
Best Regards:
@lhorgic♥️
Thank you for providing such useful information about the various sorts of graph charts that are accessible.
Thanks for reading through,am glad you found it very useful. I hope you also get to explore them thoroughly.
Note: You must enter the tag #fintech among the first 4 tags for your post to be reviewed.
Thanks you so much @fredquantum. This is much appreciated.
Understanding chart is the first thing to know in Crypto trading both line and candlestick are most preferably but I personally love candlestick chat. Thank you for sharing such a helpful post
You're are right dear friend,am glad you can relate with the post. Thanks for dropping by.
I am happy I did
Great insights on the types of grah charts available thanks alot
You have done well in explaining the different types of chart. My favorite still remains the candlestick due to its ability to show multiple informations such as market open and close
Am gald you love this content and have also learnt from it. You're right, candlestick present trader with more information when compared to the others.