[Understanding Trends II] - Crypto Academy / S5W3- Homework Post for @reminiscence01".

Good day steemians!!
It's another new week for season 5 of the steemit cryptoacademy. The lecture was all about "Understanding Trends in the market" which was similar to the previous lecture in week 1. Professor @reminiscence01 has impacted some knowledge to us on how we can understand trends in the market chart, so as to make a good entry and exist point in market. Below us my homework post for prof. @reminiscence01.
Continue reading
No (1a). EXPLAIN YOUR UNDERSTANDING OF TREND REVERSAL. WHAT IS THE BENEFIT OF IDENTIFYING TREND REVERSAL IN THE MARKET?.
In my understanding, a trend reversal is all about capturing the ending of moves or the end of trends. If you look at some of the great traders, they normally focus exclusively on reversals.
Now in a simple and clear explanation, a trend reversal is when a particular trend changes and start moving in the opposite trend i.e for example, if thr market was in a bullish trend and then changes from bullish trend and start moving bearish movement, this is what we call trend reversal.
Also we can spot trend reversal by making use of trendline because it joined the lows or highs of a particular asset when it comes to bullish trends and vice versa. We all should understand when the market is trending up, it pushes up and pulls back and on the way down, it will make a higher low. Now when the market continues trending up to make higher highs, this is a sign to traders that the market is continuing the trend. Similar with the bearish trend reversal, which forms a lower highs and lower lows.
Now lets look ar why it's important to identify trend reversal in the market
it allows traders to know the best time to enter the market or exist the market.
in futures trading, traders always take thr advantage when there is a trend reversal to make profit in the market. Either to short the market ot long the market. This is very important in spotting trend reversal in the market.
No (1b). HOW CAN FAKE REVERSAL SIGNALS BE AVOIDED IN THE MARKEK?
We should know that there is no way you can avoid fake breakout totally no matter how good a set-up is, you are still going to get cut in fake reversal, but you can limit or minimize the chance of getting cut in fake reversal.
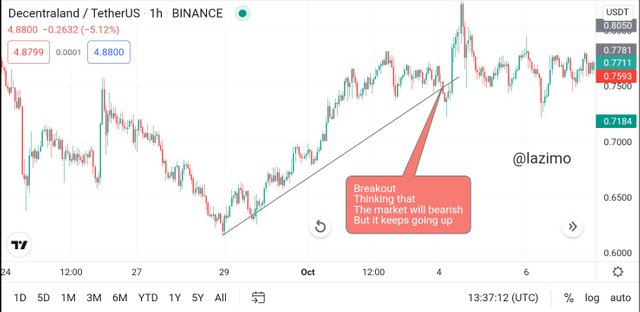
In the market, when the price is making a higher higher and higher kows, traders normally draw an uptrend trendline serving as a support point. Now when there is a breakout in the support line i.e when the price crosses the trendline, most traders normally say that the market is about to reverse and they therefore decide to take entry. Now the market didnt reverse again, but it continue with the trend it was trending earlier(uptrend). Now this will lead to loss.
So, how can we avoid this? Well, when the market breaks out the trendline and start moving down, as a trader, we should wait till when it passes the previous higher lows of the uptrend, then we will know that sellers are strongly controlling the market, that is when we take our entry and short the market. See screenshot below.
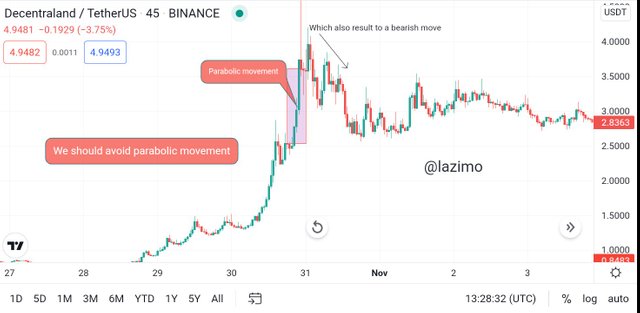
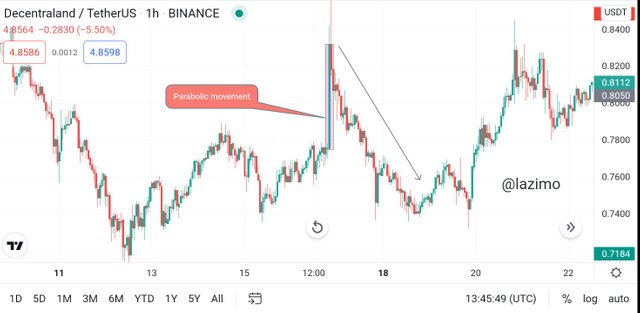
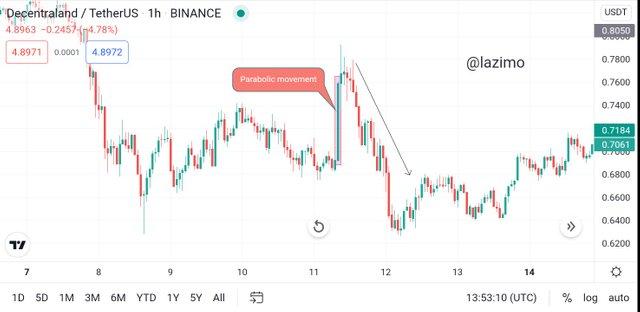
Avoid parabolic move÷ parabolic move always move up straight without any support under it or little pull back or none and still goes high. We should avoid chasing this type of move because, on a faithful moment, the market will experience a strong bearish movement and kick you out of the market. This will lead to a great loss. See screenshot below on how a parabolic moves looks like (i provide 3 charts for it).
No. (2). GIVE A DETAILED EXPLANATION ON THE FOLLOWING TREND REVERSAL IDENTIFICATION AND BACK UP YOUR EXPLANATION USING THE ORIGINAL CHART. DO THIS FOR BOTH BULLISH AND BEARISH TRENDS (SCREENSHOTS REQUIRED).
Like we discussed in the previous lecture about market structure. We all get to know that things to consider in market structure is that the new high that was created must be higher than the last high and then the new lower highs that was created must not reach the last low highs that was form in a bullish or uptrend motion. Meanwhile this is similar to downtrend motion, that the new low that was create must be lower than the last low and the new high lows must not reach the last high lows that was formed in a bearish or downtrend motion.
Then considering break of market structure, when the prices continue making higher high and higher lows for an uptrend and lower high and lower lows in downtrend, the inability for that particular trend to stop moving and then breakouts the move, is and started reversing in the opposite movement is known as break of market structure. Now below are the examples of break of market struct both bullish and bearish trend.
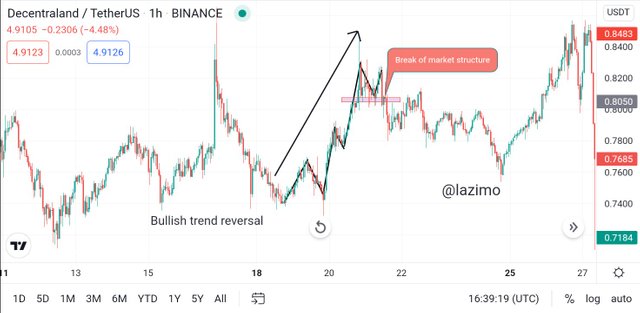
Looking at the chart above show a bullish trend reversal. As we can see in the chart, it was in a bullish movement, meanwhile it was creating a higher highs and lower high , till it get to a position whereby it could not form a new higher highs. This clearly shows us that buyers are weak in the market to be able to push it up, then a breakout occurs and sellers take over the market. This an opportunity to exist the market and start new trade by shorting the market.
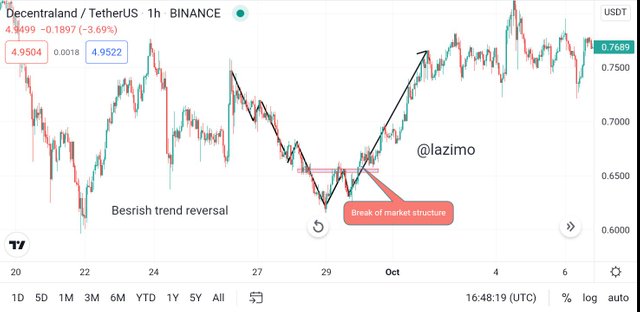
Looking at the chart above show a bearish trend reversal. As we can see in the chart, it was in a bearish movement, meanwhile it was creating a lower highs and lower lows , till it get to a position whereby it could not form a new lower lows. This clearly shows us that sellers are weak in the market to be able to push it down, then a breakout occurs and buyers take over the market. This is an opportunity to start a fresh trade by purchasing on assets.
In the previous class we also taught about trend. Trend is a technical tool in which traders make use of it to predict the next move or trend of the market price, wether bullish or bearish.
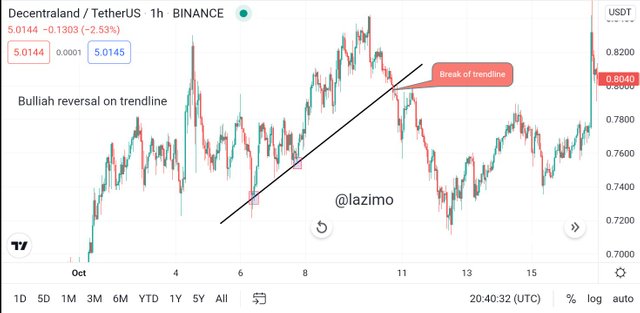
Now considering break of trendline, when the market is movement in a given direction, hitting the trendline and bouncing back on a particular motion, and decided to breakout and reversed in the oposite movement is know as break of trendline. Now lets look at example of this break of trendline in the chart both bullish and bearish.
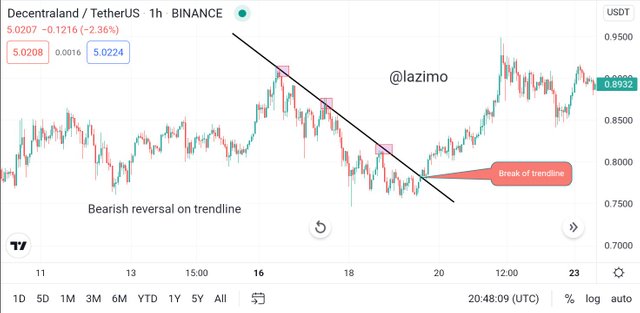
Looking at the chart above, we can see how the trend was moving up and down hitting the trendline which serves as support level and then bouncing up, buyers were strongly controlling the market untill the market breaks the trendline and start bearishing, this signal that sellers has taking over the market.
Looking at the chart above, we can see how the trend was moving up and down hitting the trendline which serves as resistance level and then pulling down, sellers were strongly controlling the market untill the market breaks the trendline and start bullishing, this signal that buyers has taking over the market.
Divergence is also a strategy traders used to analyze the market and make a better decisions while entry the market. In divergence, when the price is bullishing and it creates a lower lows in the chart, but in the indicator below which is the RSI indicator create a higher highs which signal a buy point, that the market is about to reverse to the opposite trend. Similarly, when the market us bearishing and creates a higher highs in the chart, but the indicator below which is the RSI indicator creates a lower lows which signals sell point and that the market is about to reverse to the opposite trend. Now lets look at how the divergence looks like in the chart. Both bullish and bearish trend.
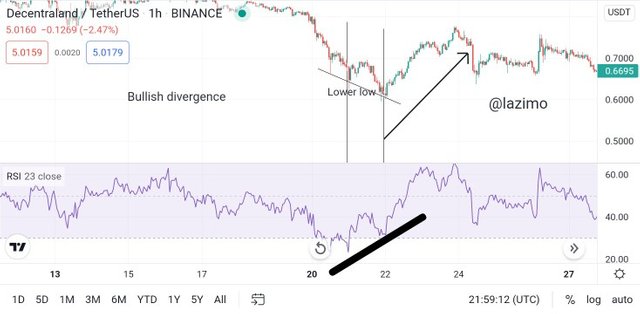
Looking at the chart above, we can see when the market creates a lower low, but the rsi indicator at the same point creates a higher high, which show that there will be a trend reversal i.e bullish market, buyers will take over market price.
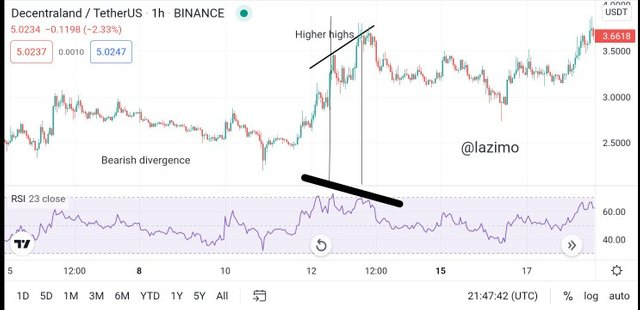
Similar to the bullish trend divergence, Looking at the chart above, we can see when the market creates a higher highs, but the rsi indicator at the same point creates a lower lows, which show that there will be a trend reversal i.e besrish market, sellers will take over market price.
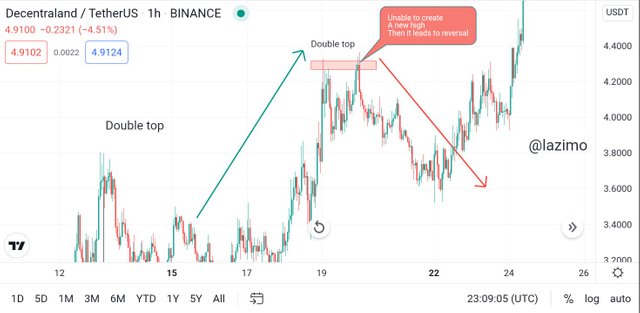
Double Top÷ in double top pattern, its usually create when the market price is trending upwards i.e after a bulliah trend in market structure, the price fails to creat a new high and the last high will be in the same point with the previous high, this shows that buyers are weak in the market and unable to create a new high, then the market trends down. When there is a double top in the market price, it signals that a bearish trend is about happen. There are things to consider during double top which are÷
the market price must not pass or cross the last high level that was created and also the last high that was create which is the second top must not go higher than the first top
Below is an example of double top chart
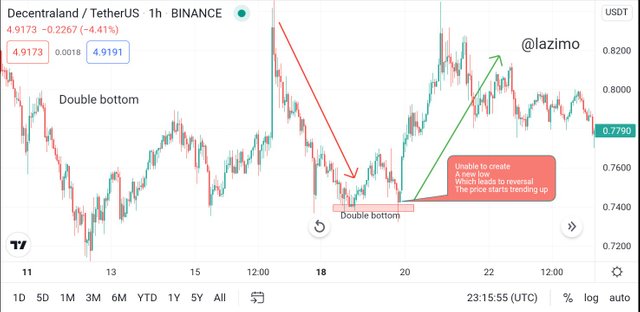
Double Bottom÷ in double bottom pattern, its usually create when the market price is trending downwards i.e after a bearish trend in market structure, the price fails to create a new low and the last low will be in the same point with the previous low, this shows that sellers are weak in the market and unable to create a new low, then the market trends up. When there is a double bottom in the market price, it signals that a bullish trend is about happen. There are things to consider during double bottom which are÷
the market price must not pass or cross the last low level that was created and also the last low that was created which is the second bottom must not go lower than the first bottom
Below is an example of double top chart
No. (3). PLACE A DEMO TRADE USING ANY CRYPTO TRADING PLATFORM AND ENTER A BUY OR SELL POSITION USING ANY OF THE ABOVE MENTIONED TREND REVERSAL/CONTINUATION PATTERN.
In this question, am placing a demo trade using paper trading on tradingview. Firstly, i connect my paper trader so that i can be able to perform a demo trade.
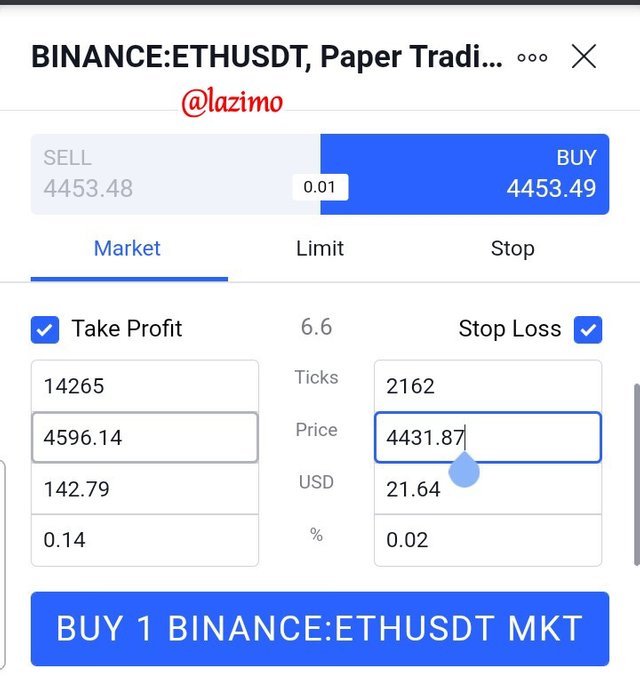
Am using ETHUSDT to perform a buy position using Double bottom to analyse the market. Screenshot below is the amount of ETHUSDT i used to trade. Actually, i used 1 ETHUSDT to buy. Then i set my take profit and stop loss and i click on buy ETHUSDT.
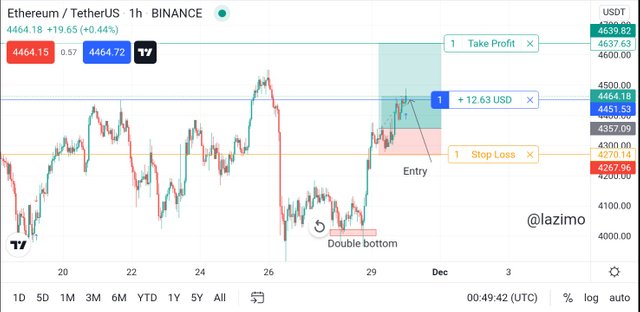
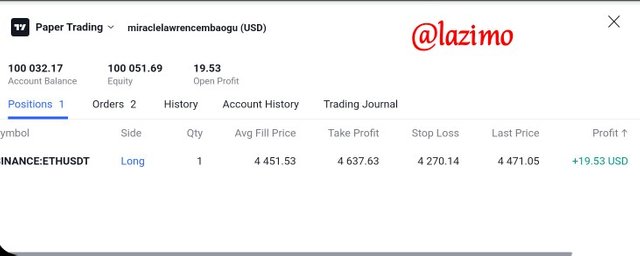
Looking at the chart below, i performed a buy position using ETHUSDT. I noticed that there was a double bottom on the price chart after a strong bearish movement. Like i stated earlier that when a double bottom occurs, it signal that there will be a bullish trend. So in this chart below, after a double bottom occurs the market started bullishing. I took my entry at 4451.53 then set my take profit at 4637.63 and set my stop loss at 4270.14. As we can see on the chart below, i have started making profit already. See screenshot
CONCLUSION
Trends and how to identify them in a market chart is what every trader need to know in order to make a better entry and exist point in the market. The lecture was well detailed and understandable, i was able to learn how to identify trends in market.
Cc-
Professor @reminiscence01

Hello @lazimo , I’m glad you participated in the 3rd week Season 5 of the Beginner’s class at the Steemit Crypto Academy. Your grades in this task are as follows:
Recommendation / Feedback:
Thank you for participating in this homework task.