Crypto Academy Season 4 [ Advanced course ] week 4: Crypto Trading With Williams % R Indicator : Homework Post for @kouba01
Hi friends, from this today lecture by @kouba01, I learn a new indicator Williams % R.

Thanks for making it like a wonderful lecture to us.

Explain the Williams %R indicator by introducing how it is calculated, how it works? And what is the best setting? With justification for your choice.
Williams %R is also an Indicator. It gives signals for Entry and Exit based on past data.
Williams %R:-
Williams %R indicator also known as Williams Percent Range Indicator. It is one type of Momentum indicator. This Indicator moves between 0 to -100.
Here Williams %R Indicator bounded with negative values. But it is a powerful and most used indicator for profitable trades need.
By using this Indicator we can identify Overbought and oversold areas very easily. If we identify these areas then we took our positions based on this very easily.
If it gives the overbought signal, It means next we see a drop in price action. So we can open a sell short position from that area.
If it gives the oversold signal, It means next we see an uptrend in price. So we can open a Buy long position from that area.
Like that on using Williams %R Indicator signals, we can do profitable trades in a specific Time frame.
Based on Williams %R Indicator we can also possible identify Entry and Exit areas very easily.
Williams %R Indicator is similar to the Stochastic oscillator. Both looking the same but their calculations are different.
Williams % R indicator was developed by Larry Williams in 1974. He is an author and commodities trader. He developed a lot of indicators for profitable trading needs. From that Williams %R Indicator is the most successful and most used Indicator.
Williams % R indicator compares an asset closing price to the high-low range over a specific period. The most recommend period is 14. This Indicator developer also recommends these 14 periods.
But as per our needs, we can change this period, as per our wish.
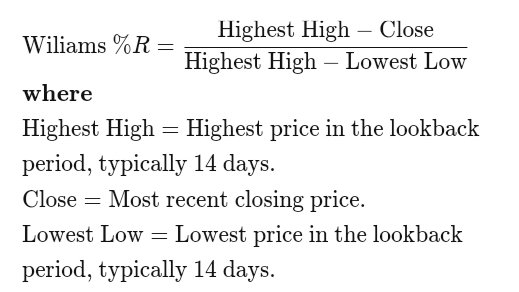
Williams %R Calculation:-
Williams %R is calculated based on price, Typically over the last 14 periods.
For calculation Williams %R is not so easy because here we need the highest price, the lowest prices over the last 14 periods, and current highs and lows also.
For easy understand I use an Excel sheet for calculating William %R.
From this, we can easily understand its calculation.
For this
Insert the high prices data for your asset in column “A” in Excel Spreadsheet.
Insert the low prices data for your asset in column “B” in Excel Spreadsheet.
-Insert the closing prices data for your asset in column “C” in Excel Spreadsheet.
- Now sort out the Lowset low prices of an asset in the last 8 days. For this use this Formula=Min(B1:B8) insert those values in Column D.
-Now sort Highest High prices on an asset in the last 8 days. For this use this formula =Max(A1:A8). Insert those values in Column E.
-Now compute current Highs in Column F.For this use this formula =(C1-E1) record those values in Column F.
-Now compute current Higher lows, those values insert in column G. For calculating this use this Formula =(E1-D1).
Now we Compute Williams %R in column H. By Using this formula = 100+((CH/HL)x100).
Like that William %R, we calculate.
Simply
Like that we calculate Williams %R Indicator.
How Williams %R work in our Trading:-
Williams %R indicators tell traders where the current price is relative to the highest high over the last 14 periods. So based on this we can take our positions very easily, and possible exit with good profits also.
We already know this indicator bounded with 0 to -100 range.
When Indicator is between 0 to -20, then we consider this area as Over Bough area. It is very near to recent high price. So then after we can expect Dumping of that price. So we can Sell Short from this price area.
When the indicator is between -80 to -100 then it's a Over Sold position. So it's very far from its previous high. So then after we can expect a good pump from this area. So we can open the Buy Long position from this area.
In Uptrend Market on using Williams %R indicator traders can do short term trades very easily.
But here traders also need to watch price momentum, need patience, after getting confirmation only we took our positions. Otherwise, we need to wait until getting another good opportunity.
Here 0 to -20 range act as Strong Resistance, at the same time -80 to -100 range act as strong support.
So based on this we can do profitable trades with help of the Williams %R Indicator very easily.

How to Add Williams %R indicator On Our Chart
This Indicator is available in Trading View. So Just go Trading View Platform. Then open your wished chart here.

Then just go IndicatorTab, Here search William from this list Just select William %R Indicator

Now it applied on our chart successfully.
Willams %R Indicator Justification:-
Now we can change Williams %R indicator settings on selecting their settings Tab.

Here we can change its visibility and Periods also. By default, it is set as 14 periods. This is most recommend and giving good results.

Those periods we can change as per our needs. But use those periods after testing those properly. Otherwise, it's better to use 14 periods itself as a good choice.
How do you interpret overbought and oversold signals with The Williams %R when trading cryptocurrencies?
Williams %R is an overbought and oversold technical indicator. This means this indicator gives Overbought and Oversold areas in the Price chart.
So using this we can identify potential Buy and Sell signals very easily.
But this Indicator gives a lot of Buy and a lot of Sell signals, from we must give our entry in Potential Buy or Potential Sell Signals only. Otherwise, we lose our trade.

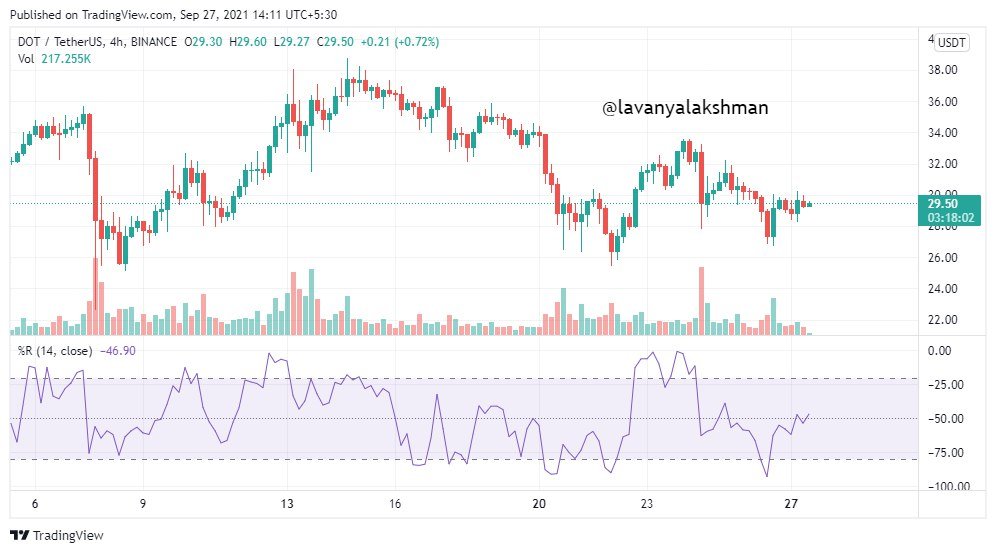
For Example in the above chart, on analysing Williams %R indicator we can see a lot of Buy and Lot Of sell signals in a specific Period.
But all those signals are not valid, only some are valid. Before giving entry we must identify, It is Potential Buy or Sell signal. Then only we need to give entry here.
Williams %R Potential Buy Signal
When Williams %R line is below the oversold line(-80) and starts risking to cross over the -80 line, then it's a Potential Buy Signal.

Williams %R Potential Sell Signal
When Williams %R line above overbought line(-20) and start falling cross over the -20 line, It's Potential Sell Signal To the traders.

Like that based on Williams %R over bough and oversold signals, we can do profitable trades very easily.
What are "failure swings" and how do you define it using The Williams %R?
A failure swing can occur when the indicator is in overbought or oversold territory and signals that the current trend is weakening and a trend reversal is highly probable.
In those situations, we see Failure Swings in our chart.
For example in the Bullish market, the indicator reaches its overbought level, again start to retest its lower point. But failed to reach its previous high. Here it makes a M pattern on the chart.
It shows weakness in that Trend. So we can understand that soon this trend her reversal. Not possible to continue some more days. Soon we see string reversal in the present trend.
It failed to make a higher high is a failure swing and indicates that the uptrend is near its end and may reverse soon.
At the same, if it is in Downtrend Market, Indicators reaches its overcome level, but not possible to make lower lows but start rebound down towards the previous lows. But it failed to reach its previous low level before turning up again. Here it makes a W Pattern.
It indicates that the downtrend is running out of momentum and may reverse soon.
The same strategy we can see in Williams %R indicator also. Whenever we see M Pattern or W Pattern it's an indication for Trend reversal. It bough be Uptrend Or Downtrend.

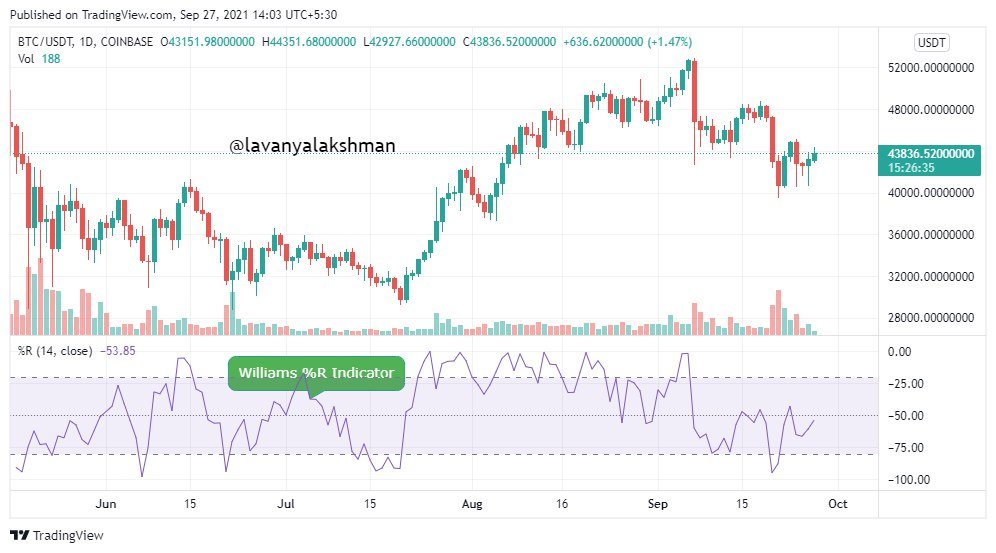
In the above chart, I took BTC/USDT 1day chart.
From 19th June to 28th June, we see W Pattern in the 1-day chart on Williams %R Indicator.
This means here it gets a failure to make lower lows And start making lower highs in Bearish Market.
In Bearish Market, It farm *** W Pattern***, So it giving strong Indication for Trend Reversal, So then after we may see Uptrend in that assets Price. But before raise it to gain give one retest, then after it starts moving upward Direction.
Like that we can identity Failure Swings in Willaims %R indicator also. Based on this we can identify the strongest Trend reversals before it occurs.
How to use bearish and bullish divergence with the Williams %R indicator? What are its main conclusions?
Williams %R indicator is a momentum Indicator. So it gives present Tred related signals like overbought and oversold territory. Based on this we can do possible Trades Very easily.
Whenever we observe dissipation of momentum, It is an Indication for Trend Reversal. Like those signals or alerts, we get from Williams % R Indicator.
Divergence occurs when price action and Williams %R indicator do not agree with each other. In that situation we Bullish or Bearish Divergence.
Bullish Divergence
Bullish Divergence is quite opposite of Bearish Divergence.
It occurs when price going Downtrend, But in Williams % R indicator shows Uptrend Market, here it Farm Bullish Divergence, Then it's a Strong Indicator for Trend Reversal. This means then after Downtrend Price Action is Not Continued soon we see Uptrend Market.
Simply A bullish divergence occurs when prices make a lower low but the Williams %R makes a higher low. In this situation, we get Bullish Divergence.

Bearish Divergence
Means simple when price going uptrend, But in Williams % R indicator dumping, and Farm bearish Divergence, Then it's a Strong Indicator for Trend Reversal. This means then after Uptrend Price Action is Not Continued soon we see Downtrend Market.
So we need to wait for grabbing good opportunities for placing Sell Shot Order rather than Buy Long.
A bearish divergence occurs when prices make a higher high, but the Williams %R refrains from registering a higher high.

Like that based on Williams % R indicator Divergence we can understand further momentum in the market. If we know those details before Trend gets a reversal, Then is possible to grab the opportunity for placing Buy long or Sell Shot. Along with that, we can exit those with good profits without any risk.
How do you spot a trend using Williams %R? How are false signals filtered?
Before we discussed how to identify Overbought and oversold positions based on Williams %R Indicator.
We all know if Williams % R indicator reaches -20 means it's an overbought territory so we need to place sell short in that price. But it's not true, after reaching the -20 area also in the uptrend market we don't see any dump in price action, it tries to go making higher high on retesting its previous support line.
This means now we understand don't place sell shortly after reaching Williams %R indicator in the -20 line. Here we need to wait to observe price momentum then only we took our positions.
For getting confirmation we can consider the -50 line also in the Williams %R indicator.
When the 14 period Williams %R reaches -20 overbought level and try to go it's the oversold level of -80, In this journey it doesn't reach -80, stay and retest in -50 level. And try to cross the -50 level, but it failed here again to move towards to -20 level. It's a strong signal for Uptrend Market Continued, It doesn't get Trend Reversal, it follows its present Trend.
Once we get confirmation about the trend the trades must wait for opportunities for placing Buy Long Trade.

Similarly, When the 14 period Williams %R reaches -80 oversold level and try to go it's the overbought level of -20, In this journey it doesn't reach -20, stay and retest in -50 level. And try to cross the -50 level, but it failed here again to move towards to -80 level. It's a strong signal for Downtrend Market Continued, It doesn't get Trend Reversal, it follows its present Trend.
Once we get confirmation about the trend the trades must wait for opportunities for placing Sell short Trade.

Like that, we can identify a Strong Uptrend or Downtrend market by analysing
Williams %R indicator.
But still some times it gives false signals. Those we eliminate with help of other indicators like EMA, MACD and many more.
With the help of other indicators helps we can easily Identify Williams %R indicator providing genuine or fake signals very easily.
Williams %R and MACD Trading Strategy:-
For Williams %R signal confirmation needs here I using MACD indicator along with Williams %R indicator.
And also use 14 periods in Williams %R indicator and MACD(12,26,9) settings.
In both combinations, we get efficiency in signals, so possible to avoid fake signals.
When Williams % R indicator trying crosse -50 line from below, and MACD try to cross 0 lines from below, Is a Buy signal. If anyone gets failed in crosses over an overbought position, then it becomes a false signal. for Buy long position. So here we need to wait until getting confirmation.

When Williams % R indicator trying crosse -50 line from above, and MACD try to cross 0 lines from above, Is a Sell signal. If anyone gets failed in crosses over the oversold position, then it becomes a false signal. So here we need to wait until getting confirmation.

Like that, with help of MACD, we can eliminate False Signals From Williams %R indicator very easily. Using both indicators help we can do profitable trades very easily.
Use the chart of any pair (eg STEEM/USDT) to present the various signals from the Williams %R indicator.
For this Illustration, I took BTC/USD 1Day chart. For confirmation I apply EMA, Then add Williams %R Indicator.
On checking the chart I get a lot of buys and sell signals. But all are not valid, After getting confirmation from EMA, We can take our positions based on Williams %R Indicator Signal.
Along with I identify Uptrend Market, Downtrend Market, Bearish Divergence and many more identities.
Those I try to mark in the chart.

In the above chart, I try to mark all signals which we get from Williams %R Indicator.
Conclusion:-
Williams % R is a momentum Indicator, So it gives Overbought or oversold signals. Along with Entry or Exit signals, we get from it.
But it gives a lot of Buy or Sell Signals, some are false, some are valid. So without confirmation from other Indicators, not possible to take our entry.
When we see Bullish Divergence in Willams %R Indicator, Then we see a big Pump in the Market.
When we see Bearish Divergence in Willams %R Indicator, Then we see a big dump in the Market.
Using the Williams %R indicator, we can Identify Trends in the Market very easily.
Williams %R is an Indicator so it works based on past data so as not to give valid signals each time. So don't trade blindly based on Indicator signals. So always need knowledge on Market moment also.
Thanks For Reading My Post
Hi @lavanyalakshman
Thanks for participating in the Steemit Crypto Academy
Feedback
This is good content. Thanks for taking in demonstrating such a clear understanding of trading with the William %R indicator.
Total| 9/10
Thanks for verify my task.