Understanding Trends II - Crypto Academy / S5W3- Homework Post for @reminiscence01

Source
Thanks to this assignment from Professor @msquaretwins I read the professor's lecture completely, and I understood perfectly each of the points now I am going to make my contribution for this week.

Explain your understanding of trend reversal. What is the benefit of identifying reversal patterns in the market?
Trends in the financial market always vary depending on the directionality of buy and bid orders depending on the interest of investors to buy the asset or sell it to take profits, I mean a trend has certain bullish or bearish periods, this means that the directionality of a trend can go either way bullish or bearish, When a trend is defined as bullish, for example, it does not always tend to rise indefinitely since it has ranges, corrections, and reversal points in previous supports always respecting the supports and in the bullish trend it always tends to break resistances to then make a correction that is called a rebound to the average, to continue rising.
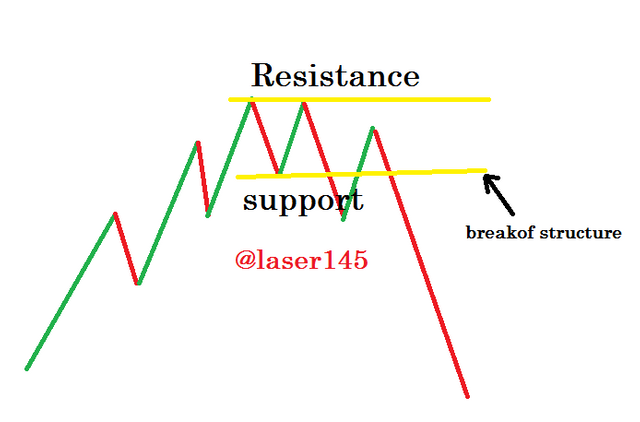
The inversion of the trend is when the price turns against the trend, for example that the previous lows already break the supports and now are lower lows and the highest highs are now lower highs, therefore I will make an illustration that indicates the inversion of the trend.
made for my
In the following illustration we can see how the uptrend we merma higher highs and higher lows, in major corrections to the mean, but then we see the break when we break the support and the previous resistance was not overcome, then at that point begins to mark the change of trend, this is called bearish reversal and when it happens on the contrary that the previous trend is bearish and changes to bullish as it is called bullish reversal.
Benefits of identifying reversal patterns in the market:
The benefit of identifying patterns, is that we can anticipate the identification of the next move in the market in technical analysis so we will have greater advantages to know this type of reversal patterns than other users who do not know what this movement is. if you quickly identify the beginning of the reversal pattern can enter into operation in short or long depending on the directionality of the movement and the change in trend to obtain the greatest possible benefits.
How can you avoid a false reversal signal in the market? (Screenshot needed)
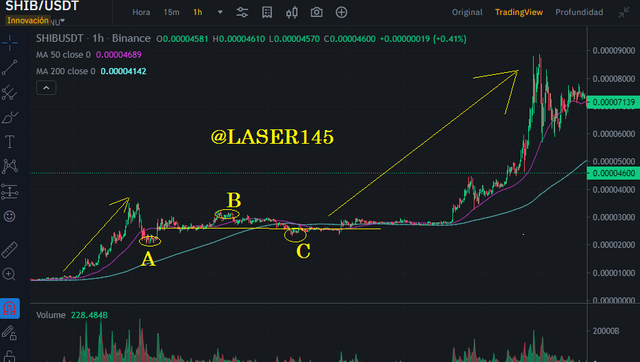
false reversal signals can be avoided by using double confirmation methods this is done by waiting for the low of the last previous high to be broken i.e. we simply have to wait for a break before entering trades, for this we will wait for it to break "A" which would be the low of "B" if it breaks the support that exists at "A" then we will be sure that the reversal is being fulfilled and the change of trend is imminent, therefore as long as it does not break the support at "A" we are not sure of this with a double confirmation.
Source
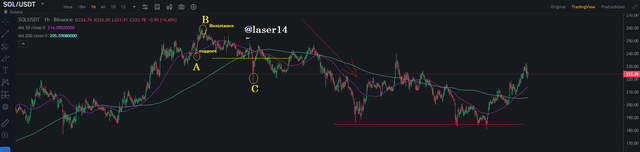
In the following chart we can see the confirmation of a false signal that made us believe that the price could go up but thanks to the double confirmation we can see that it is not so, we can see that "A" is our support "B" our resistance and "C" our break of structure to confirm the downtrend.
Source
Confirm with Indicators:
using the right indicators we can demonstrate the false reversal signals, we know it is false by the following, the chart has uptrend, with monism and high highs but in a moment the structure was broken then the previous support was broken but we see that it is still rising that is a false reversal signal.
So how can we identify those false trends with indicators? false reversal is very easy to determine by indicators.
We are going to see through the RSI indicator the divergences to determine the false reversal and a true one therefore we are going to take into account a chart and we will see what happens in them.
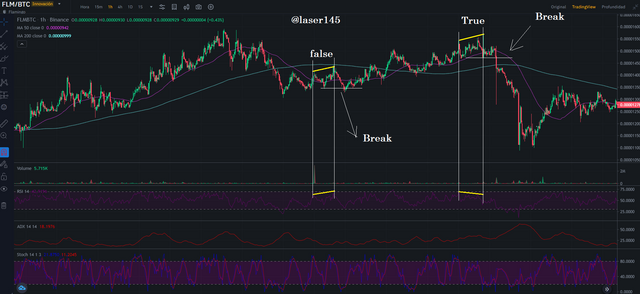
The FLM 1h chart we see how we can differentiate the movement of the false reversal and the true reversal, through the chart and divergences with the RSI indicator. As I said in the first false, it breaks the structure but continues its upward movement as there is no divergence in terms of RSI and chart, while in the true reversal we clearly see a bearish divergence breaks the structure and changes trend immediately after the pattern so if we know this movement we can enter into operation with excellent profits.
Source
Give a detailed explanation on the following trend reversal identification and support your explanation using the original chart. Do this for both uptrends and downtrends (screen shots required). (A) Market structure breakout. (B) Break of the trend line. (c) Divergence (d) Double top and double bottom
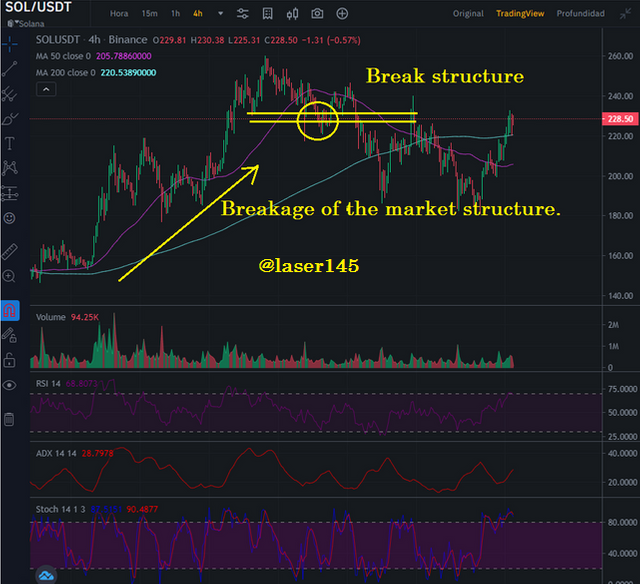
.a) Market Structure Breakout
We can see a Break of structure for the opposite side of the previous trend, there are patterns that we must understand for example in an uptrend as I said above mind has to exist higher highs and higher lows means that the previous supports are respected as the uptrend, for the downtrend is the opposite of the uptrend this has to have lower highs and lower lows and respect the previous resistances.
When one of these supports or resistances is broken it is called a break of market structure and it is almost always followed by a change of trend to the previous one.
Source
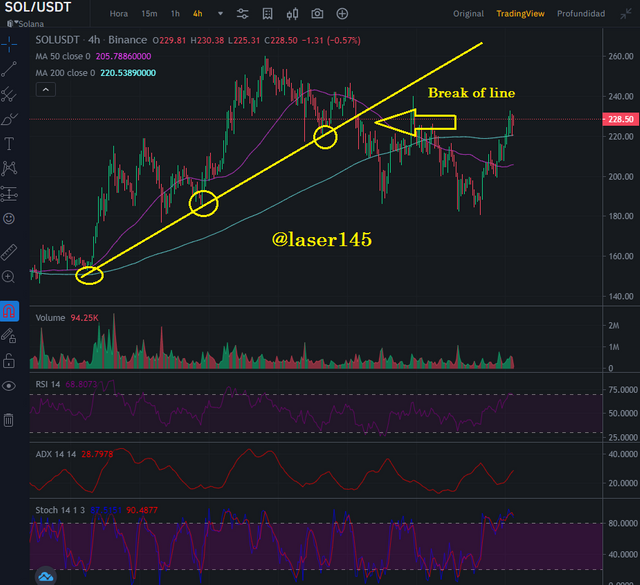
b) Trendline break
To perform the analysis of the trendline break we can use a tool called Trendline is used to connect two previous lows for an uptrend and two previous highs for the downtrend we can see that the market trend continues when the trendline is respected if it were to break then I would be changing trend, almost always in a trend with strong directionality respects it for this I recommend using it with the indicators ADX, RSI always.
Source
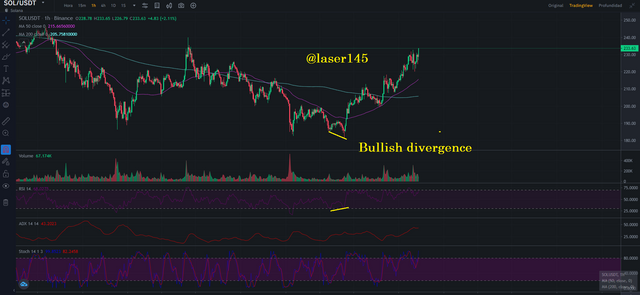
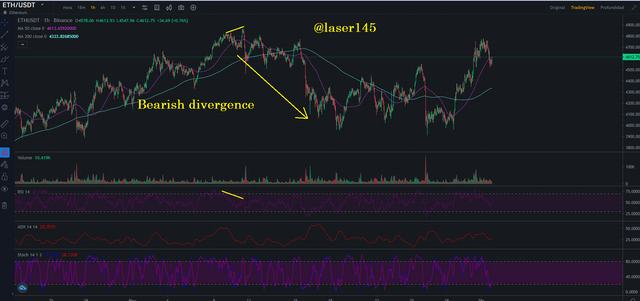
c) Divergence
Using the RSI indicator we can get an important combination that is called divergence and this occurs when the indicator does the opposite of the price action. we can say that in an uptrend the chart patterns tells us that it has higher highs but in the RSI tells us the opposite that the lows are lower then this creates a divergence therefore the trend is about to change. on the contrary if we are in a downtrend occurs when prices reach higher highs and the indicator makes us lower lows, so we can see a bullish divergence.
if we know this movement in time we can exit operations and wait for the next technical analysis for an entry and operate the market more adequately without being trapped or liquidated.
Divergencia alcista
Source
Bearish divergence
Source
d) Double top and double bottom
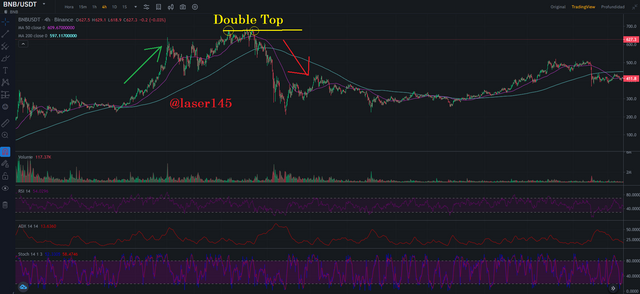
The double top is what we can identify when the trend of a market reaches the previous resistances and can not break them therefore a correction occurs, this occurs in the bullish directionality in the digital market, usually formed after a historical maximum, to occur the double top must follow a basic rules that are as follows:
The closing price must not be equal to the previous price or not exceed that maximum.
It must not for any reason create another historical maximum.
Double tops are formed in the following way:
Source
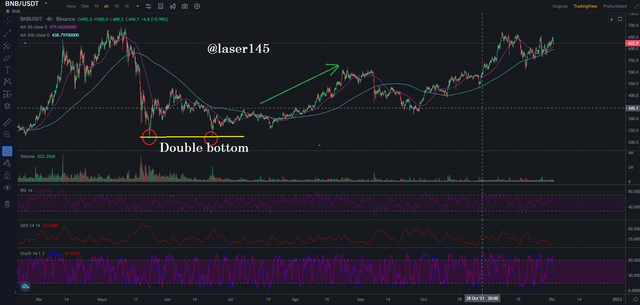
d.1) Double bottom:
Contrary to double top we can understand that the bottom indicates a change of trend from bearish to bullish so we will identify how they are formed and because the double bottom usually appear in a downtrend when the price fails to create new lows that are lower than the previous one therefore the strength of the downtrend ends, and gives way to the double bottom pattern to indicate a change of trend to the upside. This also has to comply with some basic characteristics, the lows must not be lower than the previous one, thus fulfilling all the requirements for the change of trend from bearish to bullish as we see in the next image.
Source
Place a demo trade using any crypto trading platform and enter a buy or sell position using any of the reversal/trend continuation patterns mentioned above
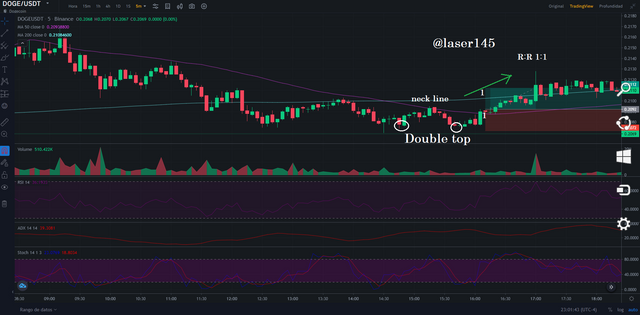
Chart is Doge/Usdt 5min:
The following chart shows a double top at the 5min timeframe so it gives me a signal to enter trade long at 10x isolated margin, therefore a trade was created at that price respecting the R 1:1 ratio.
We see that the price is turning upwards immediately after the double top, and I create a new high regardless of the higher highs, we will respect with much discipline our 1:1 ratio so that our strategy works in a proper way and we get profits more quickly.
We must create a strategy that allows us to get more profits than losses therefore following these steps we can increase our capital gradually and in a healthier way always remember to perform good technical analysis in conjunction with the fundamentals. and following the reversal patterns of the class in question.
Source
Conclusion.
Culminating the research report of the investment patterns we can conclude that the good use of these patterns , are crucial to have an effective knowledge to perform operations in the digital market as this is very volatile and plays a lot with the psychology of the tarder therefore a good knowledge base and practice prepares us to be someday more professional in the subject, really educate me enough I loved the topic we talked about and especially the dynamics of the target raised excellent. I clearly explained each of the investment patterns and I also performed an operation demonstrating that you can trade only with this strategy complemented with several indicators such as RSI, ADX, and 50MA and 200MA MOVING AVERAGE to better see the patterns and quickly identify the entries and exits of successful operation.
Cc:
@reminiscence01
Hello @laser145 , I’m glad you participated in the 3rd week Season 5 of the Beginner’s class at the Steemit Crypto Academy. Your grades in this task are as follows:
Recommendation / Feedback:
Thank you for participating in this homework task.