Homework for Professor @yousafharoonkhan | How to create an account on TradingView, how to use indicators,tools, features of tradingview

Hello everyone. This is my assignment for Professor @yousafharoonkhan recent lectures. It was a truly nice experience exploring the TradingView platform alongside the honorable professor's explanatory and insightful lessons. I have acquired a strong fundamental understanding of the TradingView platform and can perform operations as well.
The assignment was given as below:
Question No 1:
Defining the TradingView site and how to register an account in TradingView? what is the different registration plan? (screenshot necessary)
Question No 2:
Explain the different features of TradingView and what is your favorite feature and why? (screenshot necessary)
Question No 3:
How to set up a chart in TradingView and use two tools to edit it. (screenshot necessary)
Question No 4:
Explain how to add indicators in the chart, what is your favorite indicator and why? (screenshot necessary)
Question No 5:
Do you think TradingView is useful in predicting the market for a cryptocurrency (trend/price)?
6 Conclusion

Defining the TradingView site and how to register an account in TradingView? what are the different registration plans?


TradingView is a web application that enables traders and investors to make real-time trades on the market. TradingView is a popular trading platform among many traders and investors because it has outstanding charts and tools for analyzing the market, and this aids traders identify the appropriate moment to enter or exit certain markets to maximize profits or minimize losses. TradingView, additionally, renders a social network service to traders, which grants the traders the chance to communicate with one another to share trading ideas and strategies.
As a trading platform, TradingView is highly ranked and revered among traders around the globe. Data of traders are protected as the privacy of traders is respected on the platform. There are no hidden fees charged on the platform, hence registered users can have peace of mind while trading. On TradingView, traders have the access to every single stock on the market, foreign exchange, Gold, and cryptocurrency exchanges. There are over thousands of supported trading pairs and diverse trading tools to make one’s trading effective and efficient.
Aside from the web application, there are also TradingView applications available for iOS and Android devices. A desktop application is also available for traders who prefer that to a web application.
Registration Plans
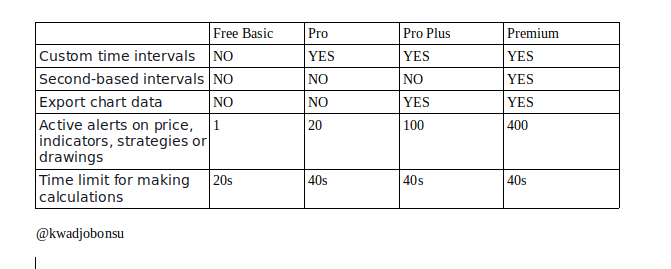
On the TradingView Platform, there are four main subscription plans: free basic, Pro, Pro+, and Premium. Each subscription has its merits and price, concerning the duration selected. The prices for the monthly and annual duration for respective paid packages are captured in the screenshot below.

The Pro package offers an Ad-free trading platform with a maximum of five indicators per Chart, two charts in one window, and twenty server-side alerts. Volume profile indicators, custom time intervals, multiple enhanced watchlists as well as Bar replay on intraday bars are also available features for Pro subscribed traders. Pro package subscribers experience regular customer service.

The Pro Plus package subscriber inherits the benefits of the Pro package in addition to others as indicated in the photo above, such as a maximum of 4 Charts in one layout, maximum of 10 indicators on one chart, ability to export Chart data, log into two devices simultaneously, and many more. Pro+ subscribers experience a customer service of priority.
The ultimate package which is the Premium package has all the benefits of the previous two as well as many superior features like logging into five devices simultaneously, a maximum of twenty-five indicators on one Chart, four hundred server-side alerts, Second-based intervals, and many more as indicated in the images above. Premium package subscribers experience first priority when it comes to customer service.
Finally, traders who are not ready to purchase any plan at the moment can opt for the Free Basic package. This helps new users in exploring the platform to assess its effectiveness before settling with a paid plan. The Free Basic package comes with a maximum of one chart per tab and only one logged-in device at a time. A maximum of three indicators can be added to a chart and has a twenty seconds time limit for making calculations.
Registration Process
For the sake of this tutorial, I am now going to show you how to sign up using the free basic package.

- So first on the landing page of the website, click on the free trial button on the top right corner.

- Scroll down the next page shown to the “Try Free Basic” button and click on it.
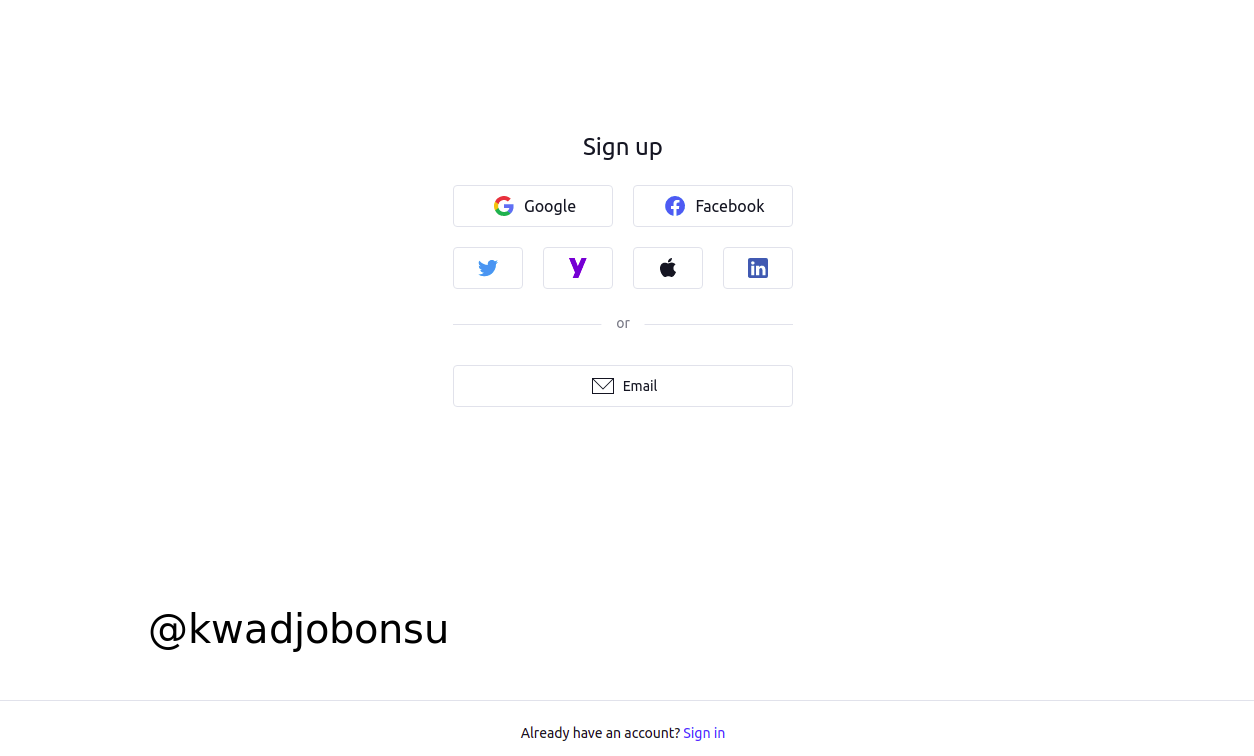
- Traders have a variety of sign-up options. The user can register using Google, Facebook, Twitter, Yahoo, Apple, LinkedIn accounts, or manually enter the email address using the last email button.

- For the manual method, the user will be asked to enter a username, an email address, and a preferred password. The respective Captcha challenges and agreements must be attended to.

- Once those are done, an activation link will be sent to the trader’s email address for activation. When the account is activated, the trader will now be able to login into TradingView with the login credentials. Completion of the trader’s profile will be required; thus, a profile picture and detail like the Name of the trader is needed to complete the registration process.
Explain the different features of TradingView and what is your favorite feature and why?

The Chart Feature
The Chart feature provides a solid graphical performance of a stock, cryptocurrency, and other assets within a selected window of time. Also, there are toolbars provided for the trader. These tools include technical indicators, Candles, create Alert, calendar, hotlists, news, and many others. All these tools are available on the toolbars to enable traders and investors to make the best of trades. Furthermore, most of these tools on TradingView are highly available for user customization. This helps investors and traders to visually differentiate the various performance of assets on the Chart and make more informed decisions on their investments.

Trade Feature
The Trade button on the navigation bar offers two options: Top Brokers and Broker Awards. Stocks and Forex traders require brokers to effectively trade since brokers serve as liquidity providers. On TradingView, the highly ranked brokers are featured together with their respective terms, conditions, offers, and real reviews from active or past clients. TradingView also presents an award in diverse categories like the Best Broker of the year, the most popular broker of the year, and many other awards to Brokers for their performance in various sectors. All these features aid investors and traders in associating with the best to achieve high and satisfactory performance on the market.

Market Feature
The Market Feature provides a current update on the prices of futures, cryptocurrency, stocks, Indices, Bonds, and many others. Supported assets on TradingView are numerous and include Futures like Crude Oil, Gold, as well as Indices like S&P 500. The respective trade pairs of the assets are also made available to the user. Such data on the price and performance of the assets help traders and investors in making a more sound financial decision. This also aids them in investing or trading on potentially bullish or bearish assets to increase their gains on the market.


Screener Features
The TradingView Screener feature offers three options: Stock Screener, Crypto Screener, and Forex Screener. These tools help the investors and traders screen or filter through the respective asset based on preferred criteria. Screeners on TradingView are not complex to employ and function very efficiently. Assets can be filtered based on their Market Capitalization, Volume, Changes, and several others. This enables investors and traders to track the performance of assets on the market and helps them to reach conclusive decisions on their investments or trades.

Community Feature
The community feature is mainly centered on the social network nature of TradingView. It gives traders and investors insights and ideas on the market. Traders and investors gain access to educative and trading notions from other traders. These ideas receive user engagements such as likes and comments. These engagements help in separating bad or non-relevant ideas from useful ones.
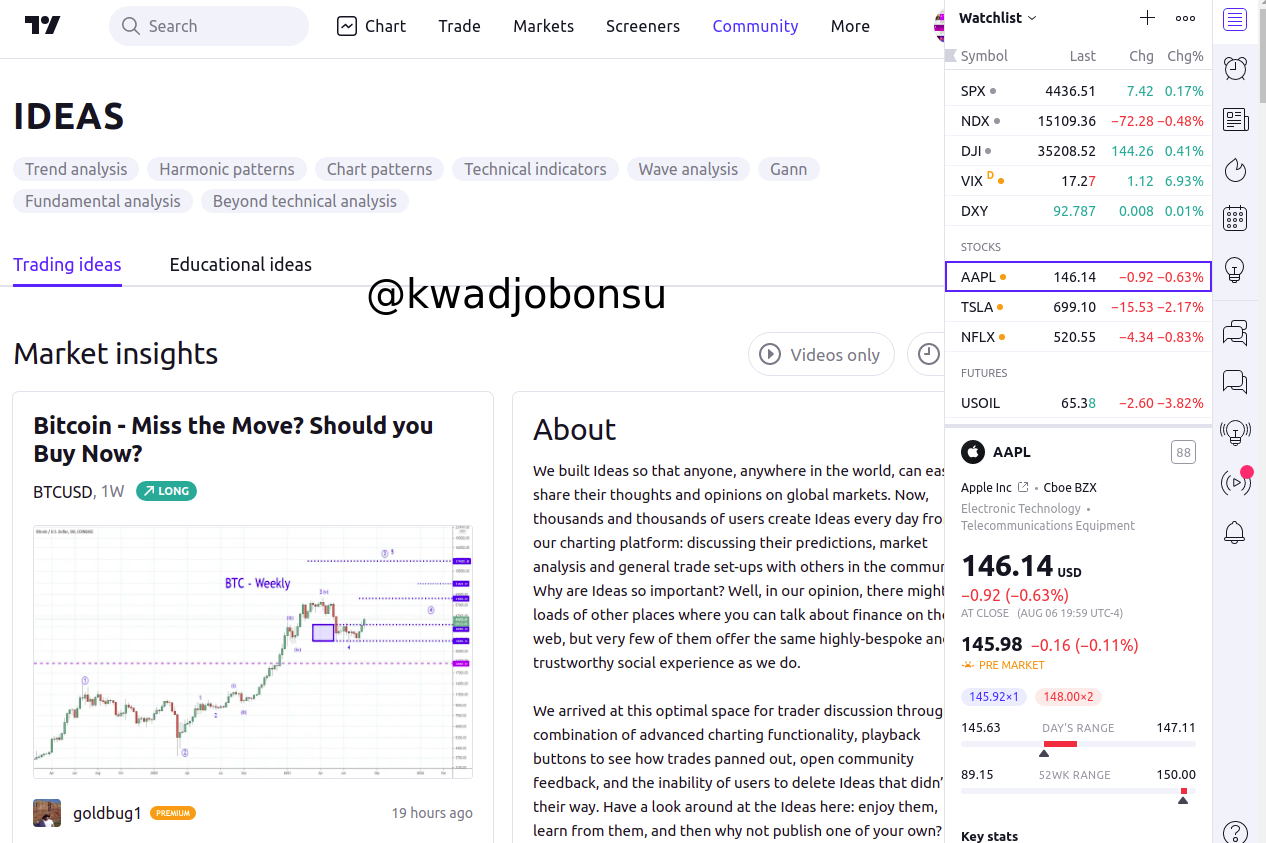
The community feature is my favorite because it is a unique trading platform feature that allows both experienced traders and novice one alike to share ideas. No trader knows it all, and every trader can learn something from other traders. Hence, the Community feature bridges this communication gap between traders and investors on the platform.
How to set up a chart in TradingView and use two tools to edit it.

- First, click on the Chart button on the navigation bar and a chart will be displayed on the screen.

The graph presents a visual representation of the performance of the respective asset over a designated period of time. This chart is the overview of Apple stocks as of the time of the screenshot.
The chart body contains meta-information such as the volume, opening price, and closing price. On the sideways and the top are various tools that can be used to perform their respective operations. The tool-set on the left hand contains technical indicators that be manually plotted on the chart. Instances of such tools include Trend line, Brush, and many others. The top highlighted toolbar contains tools like the indicators and strategies button, the settings button, publish button, and others. The far right-hand side tool-set contains tools like calendars, alerts, and others. All these tools are available for traders and investors to make the best of their trades and analysis.

The appearance of the Chart can also be customized. The Symbols (Candlesticks in this case), the Status line, and other features of the chart body can be configured to the trader's preference. I configured the color of the Symbol by choosing different colors like yellow and violet for the secondary colors of the body and borders section. The resulting image is as below:

Basic Chart Editing with the Line Trend Tool and Brush Tool

In the image above, I selected the Trend Line tool and drew a line along the bullish trend of the asset. The default color of the line was blue, but it is open to customization. Users can select preferred colors and perform other customizations like the line thickness.

In this image above, I selected the Brush tool and drew freehand lines along bearish and bullish trends of the Apple stock Chart. Color customizations of this diagram are available as well as other options such as the thickness of the line.
Explain how to add indicators in the chart, what is your favorite indicator and why?
- To add indicators to the Chart, first click on the Indicators and Strategies button on the topmost toolbar.

- A menu with a list of diverse options will be displayed.

- I selected the Exponential Moving Average Indicators from the massive lists of Indicators.

- The added EMA Indicator is added to the Chart as portrayed below. Indicators are also customizable. The colors, line thickness, and other options can be tweaked.
Exponential Moving Average Indicator is my favorite Indicator because it adds weight to recent price changes. This enables traders to observe new price trends and adjust their financial decisions accordingly. It effectively combats lagging which is quite common among some indicators. This helps traders and investors stay updated on the newest trend of the prices of assets.
Do you think TradingView is useful in predicting the market for a cryptocurrency (trend/price)
With a wide variety of indicators and availability of asset data, traders have access to relevant and profound information and tools that can be used to determine the potential trend of a cryptocurrency with a fair degree of accuracy. An in-depth understanding of the various tools and rich trading or investing experience is required for traders and investors alike, regardless of the platform to come to a conclusive and useful prediction of the price of a cryptocurrency. I firmly believe that TradingView has one the best user-friendly features, tools, and in-depth data to guide traders and investors in settling on a useful prediction on the market.
Conclusion
TradingView has a fair package price compared to its competitor. Its highly customizable features and user-friendly interface make it easy for any trader of any level to navigate the platform. The presence of the social network features also adds up to the outstanding nature of the platform. The educative and trading ideas shared on the social space prove valuable to the development of newbies and veteran traders and investors alike since no one knows it all.
Respected first thank you very much for taking interest in SteemitCryptoAcademy
Season 3 | intermediate course class week 7
thank you very much for taking interest in this class