[Bitcoin Charts] Ongoing Correction
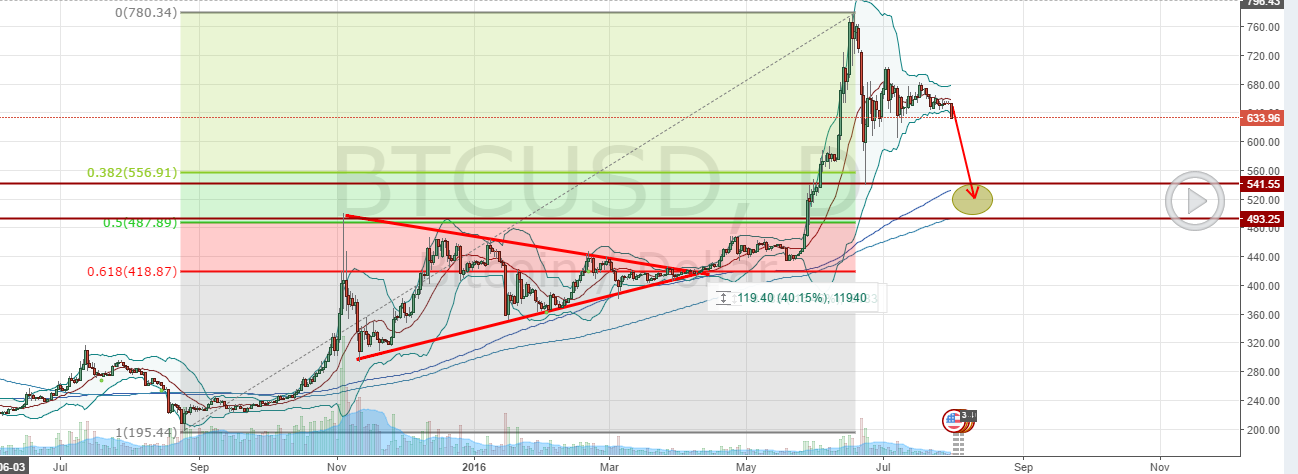
The target of ongoing drop is somewhere between weekly ma20 (540) and daily ma200 (490).
I think break of daily ma 200 has low odds to happen (or may happen without closing below it - instant bounce). If it close below d/ma200 - it would be bearish sign. Unless it doesn't - we have a normal correction of 198 - 778 rally.
The fibs are: 418 487 556
Nice @kirkwuk
Shot you an Upvote :)
Upvoted
Thank you for your analysis
Upvoted
Nice @kirkwuk
Shot you an Upvote :)
Keep up the great work @kirkwuk
Upvoted
Keep up the great work @kirkwuk
Upvoted
Keep up the great work @kirkwuk
Upvoted
Keep up the great work @kirkwuk
Upvoted
Upvoted