2018 Year in Review - Education, and whither South Africa
Ooooh, this one's timely. How frustrating is it that in South Africa we spend so much on education yet yield so little in terms of educational outcomes.

I've been doing this series of extracts of the World Bank's Year in Review: 2018 in 14 Charts, and found that the chart on educational outcomes globally leapt out at me this morning as the country was processing its annual matric results, formally announced by our Education Minister yesterday as a 78.2% pass rate for the 2018 matric class. You can find links to the rest of the series, as well as references, at the end of this post.
Only problem is, the results don't back this up
So our government crows about our achievements in education, yet our matriculants are functionally illiterate and innumerate.
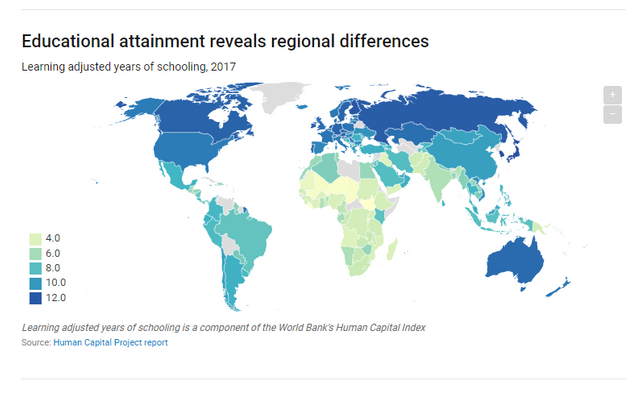
Globally, it looks like Africa and much of Asia (not China) are struggling to achieve more than 6 "learning adjusted years of schooling", which is another way of expressing "quality of education", for the year 2017.
The World Bank has published a super 3 or so minute video which explains why the Human Capital Index (HCI) is important. The main takeaway is that if a country has an HCI of whatever, say 0.7, then the country is 70% productive and could be 100%-70%=30% more productive.
How does South Africa compare globally?
You can't argue with outcomes. You can argue a lot over how much you've invested into something, but in the end it's the results that count. How do Africa and South Africa compare globally?
You can see on the map above that South Africa does really poorly in terms of educational outcomes in terms of "learning adjusted years of schooling", defined by the World Bank as follows:
Learning-Adjusted Years of School are calculated by multiplying the estimates of Expected Years of School by the ratio of most recent Harmonized Test Score to 625, where 625 corresponds to advancement attainment on the TIMSS (Trends in International Mathematics and Science Study) test.
In fact, we sat on an unenviable 5.1 years, compared to say, Afghanistan where the Taliban have worked hard to systematically destroy their educational system and have only gotten their Learning-Adjusted Years of School down to 4.9, and countries in West Africa like Niger (2.6) and Mali (2.7) have nowhere to look but up. We may enjoy bashing Zimbabwe, but they sit on 6.3 Learning-Adjusted Years of School. Zambia sits on 5.2, Botswana on 5.3 and Namibia on 5.8. Any sense of superiority our government may feel about our educational outcomes should be quelled by these outcomes.
But wait, there's more
Okay, that was one indicator, right? Let's look at another, the Harmonized Test scores, which are defined as follows:
Harmonized Test Scores from major international student achievement testing programs. They are measured in TIMMS-equivalent units, where 300 is minimal attainment and 625 is advanced attainment. Most recent estimates are used. The year of the most recent estimate is shown in the data notes. Test scores from the following testing programs are included: • TIMSS/PIRLS: Refers to the average of test scores from TIMSS (Trends in International Mathematics and Science Study) and PIRLS (Progress in International Reading Literacy Study), both carried out by the International Association for the Evaluation of Educational Achievement. Data from each PIRLS round is moved to the year of the nearest TIMSS round and averaged with the TIMSS data. • PISA: Refers to test scores from the Programme for International Student Assessment • PISA+TIMSS/PIRLS: Refers to the average of these programs for countries and years where both are available • SACMEQ: Refers to test scores from the Southern and Eastern Africa Consortium for Monitoring Educational Quality • PASEC: Refers to test scores from the Program of Analysis of Education Systems • LLECE: Refers to test scores from the Latin American Laboratory for Assessment of the Quality of Education • EGRA: Refers to test scores from Early Grade Reading Assessments.
That's a mouthful, but the upshot is that the global graph represents as fair a comparison as possible.
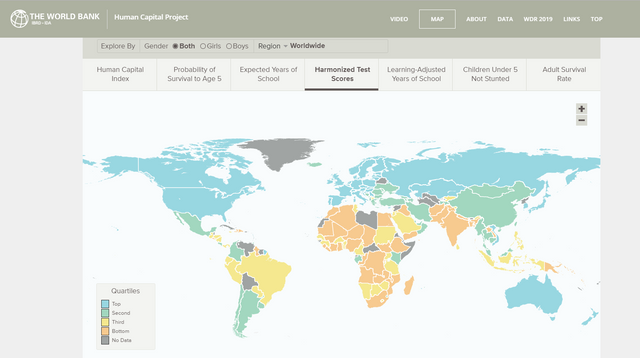
And South Africa once again is in the bottom quartile.
That doesn't make sense - how do we have such a great matric pass rate and such lousy educational outcomes?
Ah, because someone's cooking the books, that's why. Lies, damn lies, and statistics and all that.
Here are a couple of alternative perspectives, one from an educational economist (so we can expect a degree of independence from him) and another from the opposition party (so we can expect some partisan lack of perspective - let's see how different their views are).
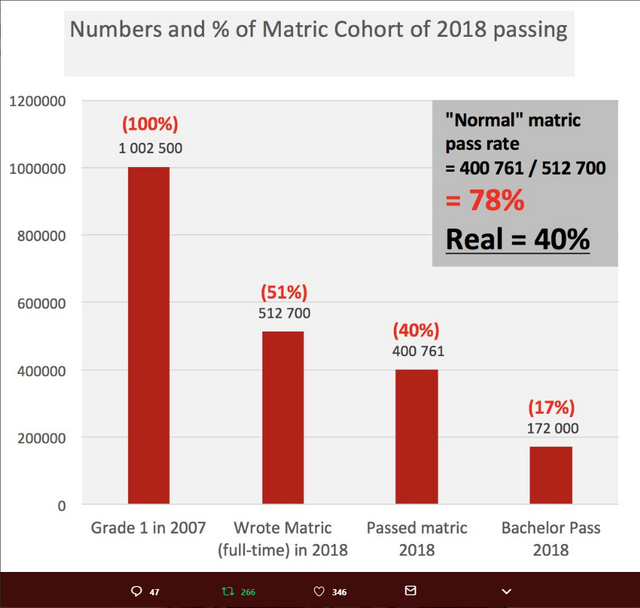
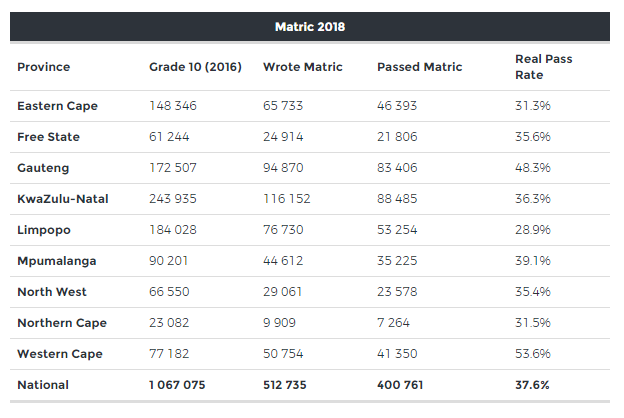
Hmmmm...the graph and the table pretty much say the same thing (so partisan schmartisan - let's look at the evidence regardless of who says it), that by failing to take into account where those who started in the educational system disappeared to by their matric year, the Department of Education is royally cooking the books and more importantly, completely failing those youth. The matric pass rate is closer to 40% than the near 80% the government claims, and it proves the old adage that you get the results you measure.
Perhaps South Africa should be paying closer attention to the Human Capital Index and what it means for our country. For those who've gone to the link and moused on the graph, you'll know that South Africa's HCI value is 0.41. 41%. That means we're leaving 59% of our potential productivity in the graveyard of uneducated, illiterate and innumerate minds. Think about that.
References
World Bank - Year in Review: 2018 in 14 Charts
World Bank Human Capital Project
https://twitter.com/NicSpaull/status/1080896384046432256
https://mybroadband.co.za/news/government/290752-the-massive-matric-2018-failure-number-37-6-pass-rate.html
Other posts in what now seems to be a series
https://steemit.com/economy/@kiligirl/do-you-want-the-good-news-or-the-bad-news-first
https://steemit.com/womensrights/@kiligirl/women-s-lot-in-the-world-is-improving-slowly
https://steemit.com/waste/@kiligirl/waste-post-hasty
https://steemit.com/global/@kiligirl/2018-in-review-migrants-and-refugees
https://steemit.com/global/@kiligirl/2018-year-in-review-climate-change-the-guy-with-the-knife-behind-the-shower-curtain
Team South Africa banner designed by @bearone