Highly Profitable Trading Strategy with VuManChu Cipher B - Steemit Crypto Academy | S5W6 | Homework Post for @reddileep
Today in this post I will share with you my Homework Task (Season 5/Week-6) for Professor @reddileep. The course that the professor @reddileep has discussed with us "Highly Profitable Trading Strategy with VuManChu Cipher B". I have learned a lot about The Trading Crypto with VuManChu Cipher B from this lecture of the professor.

Question-01
Define VuManChu Cipher B Indicator in your own words.
The VuManChu Cipher B Indicator is a technology-based index consisting of a combination of multiple indicators. This allows traders to detect bullish and bearish signals. Because this VuManChu Cipher B Indicator has Relative Strength Index (RSI), Market volume, Money flow and Market Momentum. Since we can use a few more indicators through this indicator, this indicator is a combination of several other indicators. In a word, we can say "many within one". When we install the VuManChu Cipher B Indicator on our chart, we can see that this indicator is very colorful and we will have many indicators together.
And of course we know that, in particular, I am a user of the Trading View platform. And we can use only three indicators together on the TradingView platform. If you want to use the above three indicators, you have to buy a premium package and use it. Personally, I also do not use the premium package yet. I still use it for free. So I can only use 3 indicators. And with this VuManChu Cipher B Indicator I get permission for many indicators using one indicator. So for those who use free this indicator is a very effective indicator and a very profitable indicator.
A trader uses web trends to identify the current trend using this VuManChu Cipher B Indicator. Using Money Flow, a trader can identify the current trends in the market and get a signal to trade for profit. There are two indicators of red and green color in the wave trend. Generated after a crossover it basically indicates the market in price control. There are two pointers of red and green. The red color refers to the seller and the green color refers to the buyer. We get a lot of trade signals through this green color and red color point and from here we can understand a lot of information for our business.
We can identify the red and green color signals as strong buying or selling signals. Because when we find the red dot it means that we understand that liquidity is leaving the property and through the green color we can understand that liquidity is entering the property. Through this we get strong buying and selling signals.
The indicator has a lot to do with demand and supply. We must know that when there is a lot of pressure to buy, the demand for those assets is created and it helps to increase the value of the assets. When there is a lot of selling pressure, more supply is created and this supply helps to reduce the value of assets. So VuManChu Cipher B Indicator can confirm the directional movement of the asset price.
Question-02
How to customize the VuManChu Cipher B Indicator according to our requirements?
We will use any one of the trading chart platforms to customize the VuManChu Cipher B Indicator. Today I will use one of my favorite platforms tradingview.com Platform to customize it. So first I go to the official website of tradingview.com.
STEP-01: We will open the chart after coming to the official website of the tradingview.com. After opening the chart we will click on the indicator button.
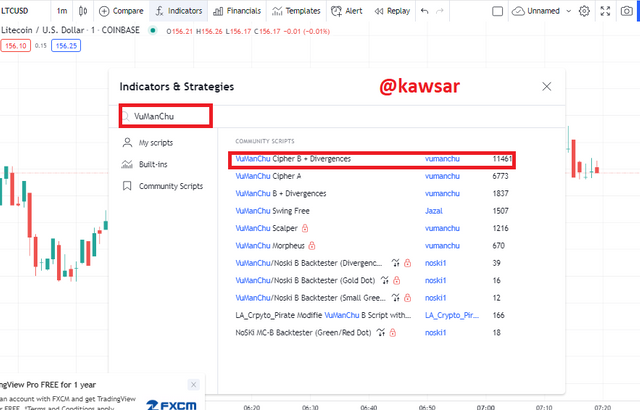
STEP-02: After clicking on the indicators button, a new window will open in front of us. There will be a search option, in the search option we will type "VuManChu", after typing it the indicator will show down in front of us. I have marked it in red in the screenshot above. After clicking on it, VuManChu Cipher B Indicator will be installed in our chart.
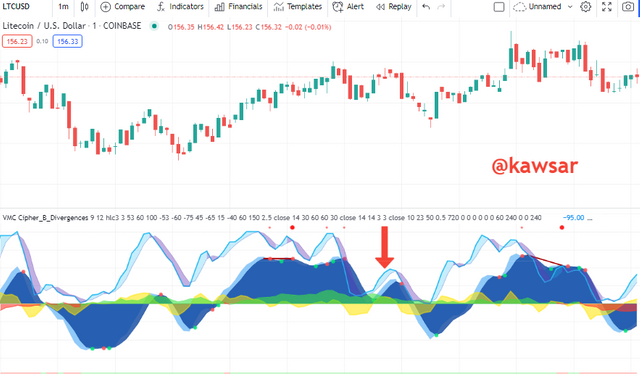
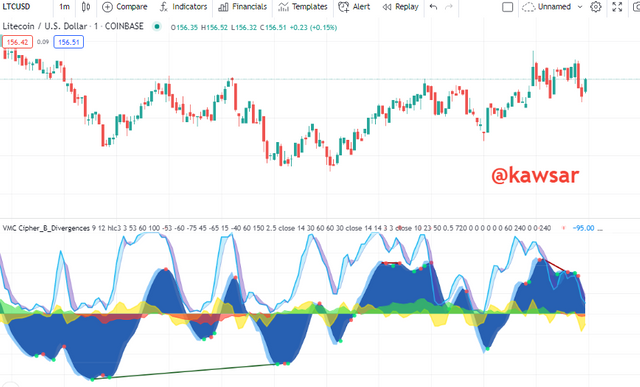
STEP-03: The VuManChu Cipher B Indicator has been added to our chart, as we can see in the screenshot above.
VuManChu Cipher B Indicator Settings:
We have already installed VuManChu Cipher B Indicator on our charts and we can customize it as we wish by clicking on the Settings button of the indicators and we can change it as we like.
I have clicked on the indicator's settings button to change anything. Which I have shown in the screenshot below marked in red. The option to change will open in front of us.
Inputs
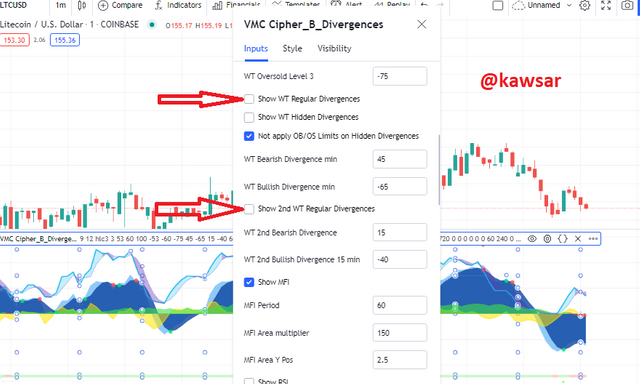
The first option we get after opening the settings button is input. Within this input option we need to uncheck two things. The two topics are Show WT Regular Divergences "and" Show 2nd WT Regular Divergences. The reason for raising these two issues is because of the trading techniques taught by the professor.
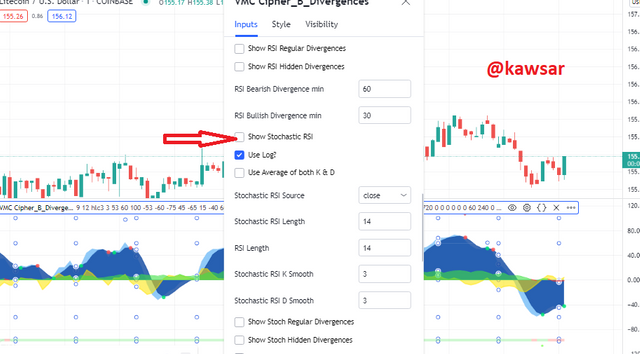
Then I have to uncheck one more thing from this screenshot above, that is Show Stochastic RSI. Which I have marked in red in the screenshot above. This is also due to the trading strategy shown by my professor.
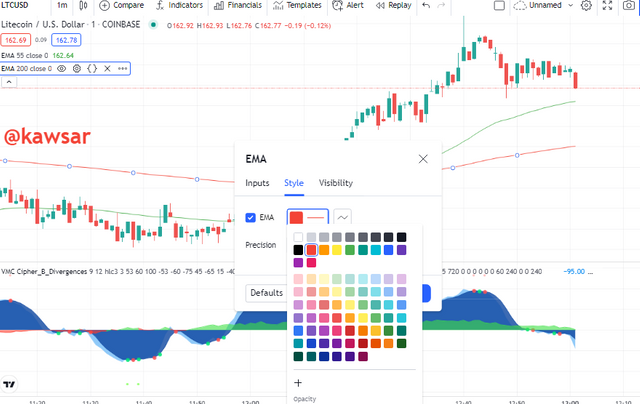
Style
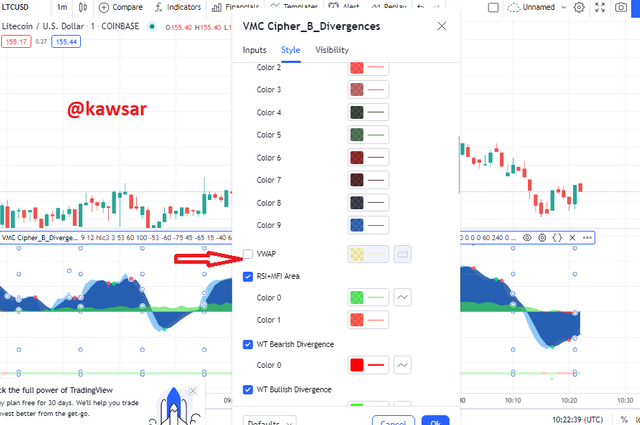
The next option we get is style. We need to remove the tick mark from this "VWAP" for the trading strategy shown by the professor from the style options.
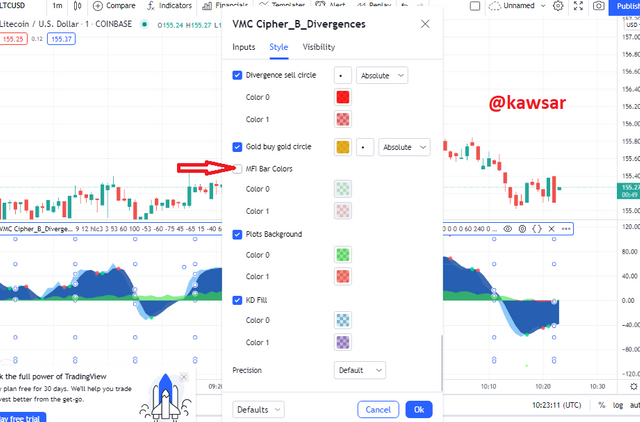
Then we need to remove one more tick mark from "MFI Bar Colors" from the screenshot above. Once we remove it, we will be able to customize it from the style options.
Question-03
Explain the appearance of the VuManChu Cipher B Indicator through screenshots.
We have already shown how to add VuManChu Cipher B Indicator to our chart. We will now discuss the appearance of this VuManChu Cipher B Indicator.
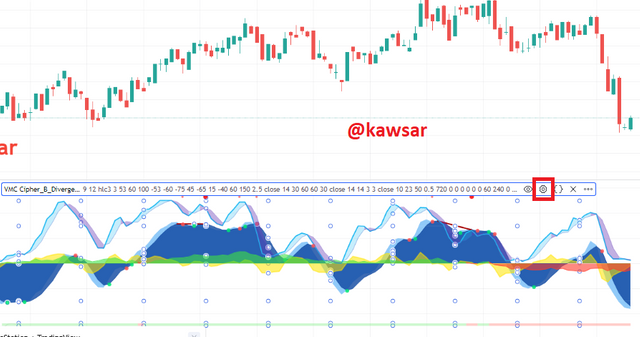
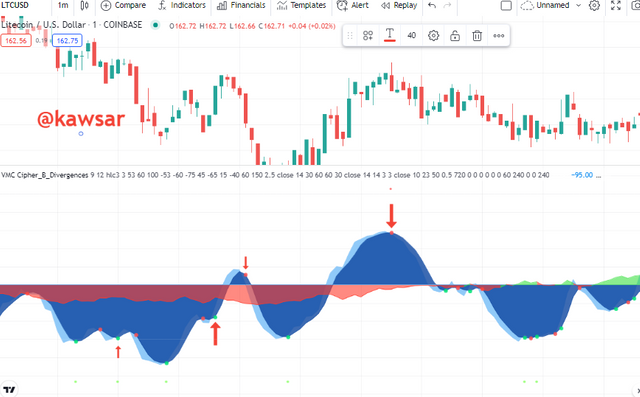
We have already shown how to add VuManChu Cipher B Indicator to our chart. We will now discuss the appearance of this VuManChu Cipher B Indicator. As I mentioned earlier, the VuManChu Cipher B indicator is a wave trend indicator. The VuManChu Cipher B indicator is usually blue. We can divide this blue color into two parts. Because there are two colors inside this blue color. One is light blue, the other is garo blue. There are two different colors inside this blue. By these we can understand the sign of buying too much or selling too much in the market.
Also here red and green can be the dots of these two colors. The green dots indicate an upward trend naturally and the red dots indicate a downward market trend. Also, when two lines are crossed, an indication that the market trend is changing is understood.
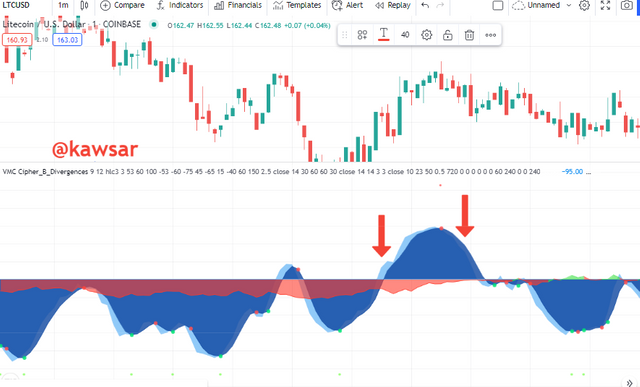
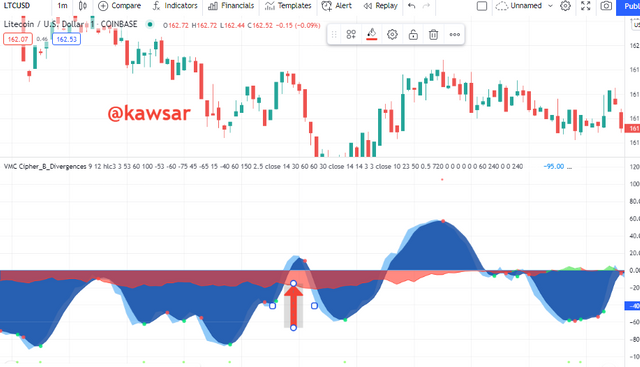
Also below the zero line we see the presence of red clouds. This means that we understand that there is an indication of the speed and decrease of wealth. And when money flows due to excess sales, the cloud turns red and when money flows due to excess buying, its color turns green. Thus VuManChu Cipher B Indicator is a very suitable indicator for a trader to trade well. It plays a very important role in trading for a trader.
Question-04
Demonstrate your preparation for the Trading Strategy combining other indicators. (Instead of showing the addition of indicators to the chart, you should explain the purpose of each indicator for this trading strategy.)
We must know that no technical indicator can ever give us 100% accurate signal. They can sometimes create false signals. In that case a successful or conscious trader will never use such a technical indicator to be 100% sure that he is not trading. Rather a conscious trader should always use a technical indicator as well as other indicators. Verification is done along with other technical analysis and other indicators to make sure it is true. So if ever these technical indicators give us any false or misleading signal then we can verify it and we can protect ourselves from loss.
So today I will test how to make a good trading decision by combining Exponential Moving Average (EMA) indicator with VuManChu Cipher B Indicator. I will add 200 period (EMA) and 55 period (EMA) to my chart. I am showing the process of adding below through the screenshot.
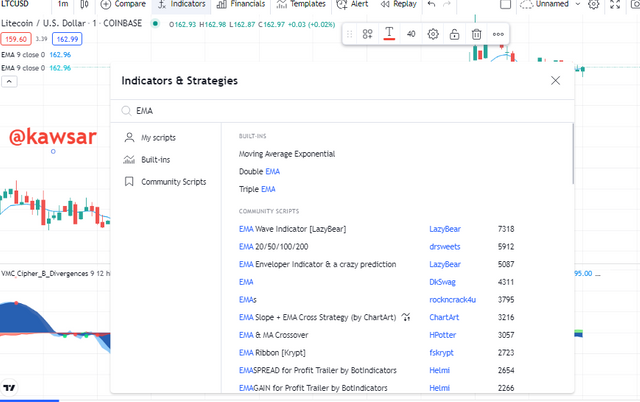
STEP-01: To add (EMA) I will first go to the official website of a tradingview.com platform of my choice. After coming to the chart here, I will click on the indicator button at the top. After clicking on the indicator button a search bar will appear, there I will search by typing "EMA". After searching, first Moving Average Exponential will come. If we click on the Moving Average Exponential button, it will be added to the chart.
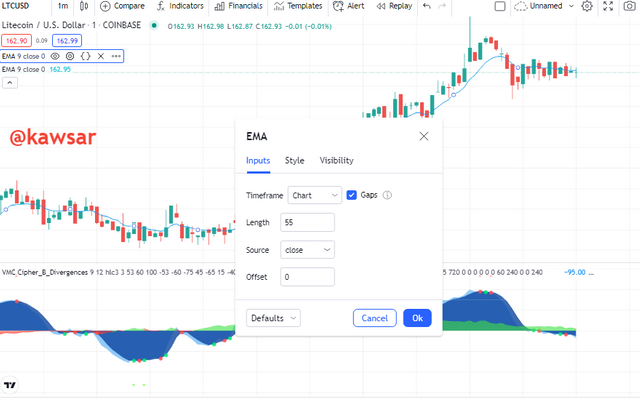
STEP-02: Has been added to the chart (EMA). This time I will first set the 55 day indicator. To do this, first click on an indicator's Settings button. I will make Length 55 from inputs option.
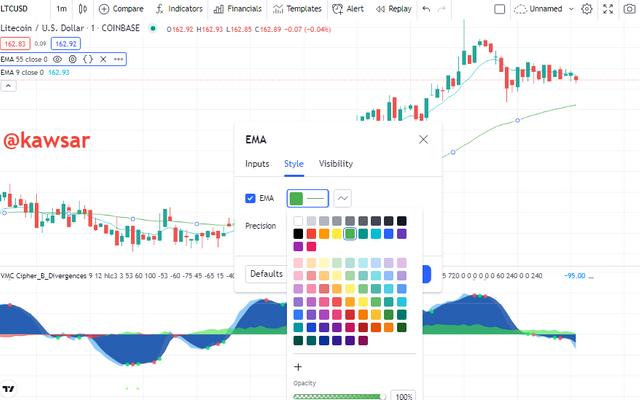
STEP-03: I will make the color of the 55 day indicator green. For this, I will first come to the style option, select the color and give it a green color.
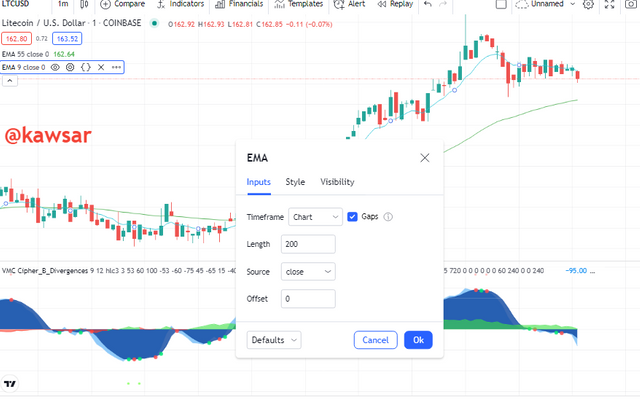
STEP-04: This time I will first set the 200 day indicator. To do this, first click on the indicator settings button. I will give Length 200 from inputs.
STEP-05: I will make the color of the 200 day indicator green. For this, I will first come to the style option, select the color and give it a green color.
One thing we do know is that 55 (EMA) and 200 (EMA) are used together. In this course the professor shared it with us and taught us through these two (EMA). We can get a strong trading signal using this (EMA). I can understand whether the market is in a bullish trend or a bearish trend now. When the market trend changes, we can understand through (EMA). We can also understand who owns the market right now, buyers or sellers.
Also when there is a crossing between these two (EMA) through this crossover we can get a good idea about the market. For example, when the 55 (EMA) moving average crosses 200 (EMA) at the top, we call it the Golden Cross, and when it crosses the bottom, we call it the Death Cross. Golden cross means we understand a buy signal and death cross means we understand a sell signal.
We can confirm such things with these two (EMA) and when we add this VuManChu Cipher B indicator with these two (EMA). Then we can get a strong trading signal and when we are fairly sure we can verify the trading signal. That's why I will definitely share a screenshot.
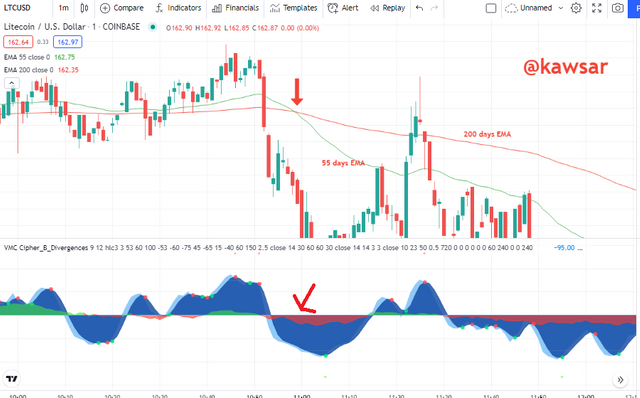
Above I have shared a screenshot and in this screenshot we can see that the 55 day (EMA) has crossed the 200 (EMA) downwards. This means we understand that it is a death cross and below it we can see the red dot on the VuManChu Cipher B indicator. Which signals the bearish so we can see that we are getting the same signal using two indicators.
Question-05
Graphically explain how to use VuManChu Cipher B Indicator for Successful Trading.
In the previous question we learned how to get a good trade signal by combining VuManChu Cipher B Indicator and 55 Periods (EMA) and 200 Periods (EMA). We use these two indicators to verify the trading signals and how to understand and trade the correct or true.
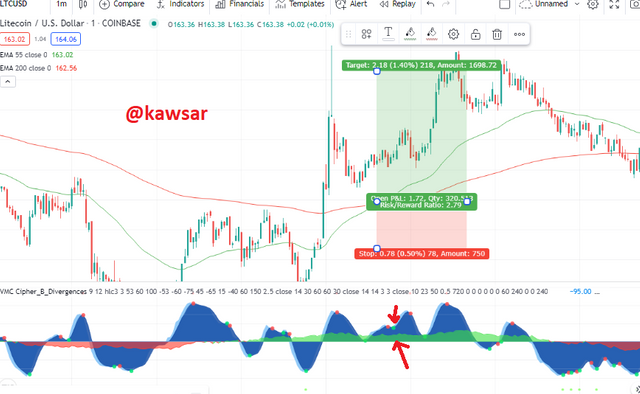
We already know that when there is a golden one it gives a buy signal and the golden cross means we understand that the buyers are now occupying the market and occupying them. We can place a strong buy order. This we can understand from the 55 period (EMA) and the 200 period (EMA) through the cross or the golden cross and the screenshot below shows an example that a golden happened here. So I can take an entry there with the 55 Period (EMA) and 200 Period (EMA) indicators.
Also in the screenshot below I also show that besides 55 Periods (EMA) and 200 Periods (EMA) we have received a signal through VuManChu Cipher B Indicator. Clouds should be green on such MFI index, which we have got and we know that light blue wave must be a crossing and dark blue wave must be a green dot. So we can take a buy entry here and I think there is a good profit here on a buy signal.
Question-06
Using the knowledge gained from previous lessons, do a better Technical Analysis combining this trading Strategy and make a real buy or sell order in a verified exchange. (You should demonstrate all the relevant details including entry point, exit point, resistance lines, support lines or any other trading pattern)
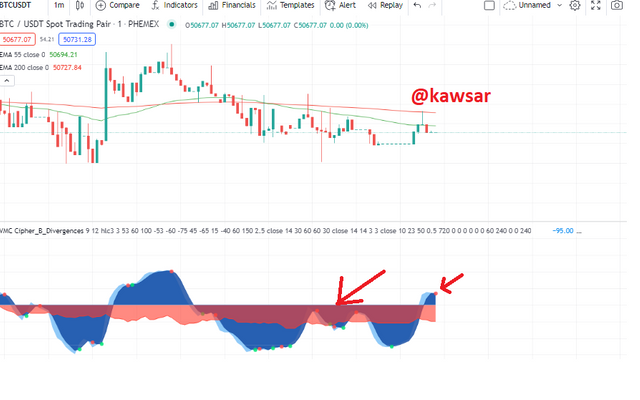
In this section I will try to analyze from one of my favorite platforms tradingview.com. Today I will try to do an analysis on BTC / USD pair.
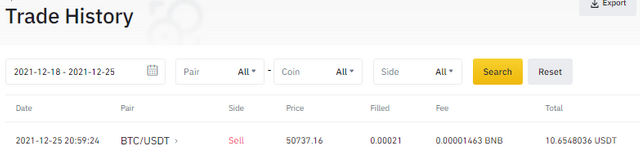
Received a cell signal via VuManChu Cipher B Indicator. For example the MFI index should be cloud red, which we got and got red dot. Through these we understand that sellers are active now and the market is likely to go down here.
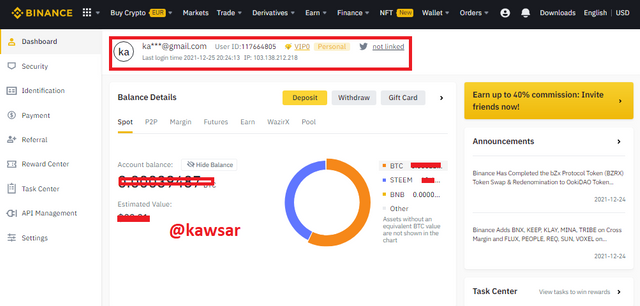
I made this trade from my verified binance account.
A screenshot of the Sell order I placed.
Conclusion
Finally I can say that a trader using this VuManChu Cipher B Indicator can take his trading experience much further. I am very grateful to the professor for discussing such a beautiful subject that I can get very good signals using this as well as other indicators and make sure that I can trade.