ETH/USD My failure ascending Triangle and What's next
My update regarding of fail 'potential' ETH/USD
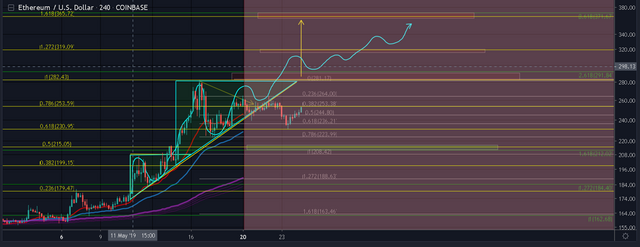
in 4 hour time frame. it did touch the 0.618 ($230) fib as a sweet spot to retrace and it did bounce from that level and currently testing 0.786 ($252).. also, the price action did manage to go above 20 and 50 EMA again as a bullish sign.
the indicators might as well shift into a bullish momentum from macd as the sell volume getting smaller and CMF is pointing upward..
.png)
looking closely as i drew a trend line.. i might be appear another symmetrical triangle between 0.618 fib and 0.786 fib (short term fib) which i expect will be a consolidation area if the price didnt manage to broke out the 0.786 fib as in present time it's testing it's area.
In daily chart.. it's still in bullish from MACD and CMF.
.png)
In my Opinion or summary , currently it's still testing the resistance on 0.786 fib and it could be broken and act as a support for establish a further impulse movement in short distant future.
conversely, if it fail to broke 0.786 fib. i think it will consolidating around 230 - 250 area before it start a next impulse movement.
breaking and candle closes below $230 is a bearish sign as a descending triangle pattern looming in future decline in price action. conversely, it would be invalidated as if the price could breach and closes above 0.786 fib and stay above it.
.png)
please take this idea as a grain of salt as reality always differ from what i expect as this post merely just an opinion.
and please feel free to share what your thought on comment section.
peace.