ADA/BTC Update and outlook
Short update from my previous post about experimental strategy using compiled dominance charts to determent which currently money will be flowing in the listed altcoin i put into chart for short term.
here's for the dominance of cardano that currently is spiking up.
.png)
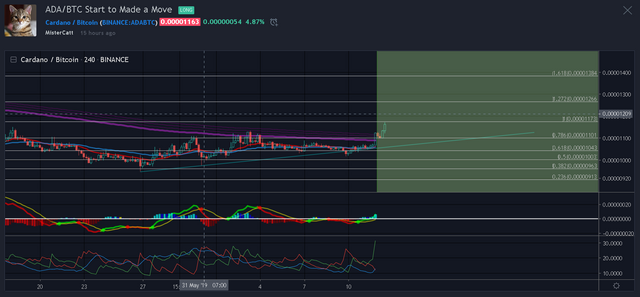
Chart for cardano as its for now and long term outlook on 1 day chart ...
.png)
you can click the chart and press ctrl+ middle scroll mouse to see more detail for potential support and resistance.
Indicator:
DMI: DMI+ is above DMI- which indicate bullish trend is currently dominating the bearish trend.. keep in mind the DMX (momentum strenght) is still weak (<25 is consider weak) but it could build up as the time is progressing.
MACD : buyer histogram is continue to build up, MACD line is ready to enter a bullish area (above 0) i expect a minor consolidation during transcending period to bullish area
Volume MA is still weak considered this price is moving quite fast
EMA : currently 21 EMA is already broken and surpass 51 EMA but not confirmed yet. i believe a high probability to consolidate for a short time for bullish momentum being build and test 200 EMA line which is a high resistance area..
followed by a blue trendline is which a guide line for this longevity of this bullish trend is sighted. This post will become invalidated if the price action manage to get below this trendline or prolonged sideways.
please take this idea as a grain of salt as reality always differ from what i expect as this post merely just an opinion.
and please feel free to share what your thought on comment section.
peace.