Interesting geometry in the market of crypto-currencies: an overview of popular technical analysis patterns
Graphic figures (patterns), especially in combination with other instruments of technical analysis ( indicators, oscillators, Fibonacci levels, etc.), can give the trader a good idea of the further most likely scenarios of the asset price movement.
In this review, we will consider popular figures for the continuation of the trend and reversal, including the Triangle, Klin, Rectangle, Head and Shoulders, Flag, and their varieties.
Patterns of the trend reversal
As you can guess from the title, it will be about the figures of technical analysis, signaling that the trend is about to change course, and with a high probability the price will go in the opposite direction.
So, if an upward trend looms over the reversal pattern, it will hint to the trader about the upcoming change in the trend from bullish to bearish. Conversely, if the reversal pattern is formed on a downtrend, then, most likely, the upward trend will change not far off, providing a good opportunity to open a long position.
Double top . This figure of technical analysis (TA) signals the approaching interception of the initiative by the bears. From the title it is clear that this figure consists of two successive and approximately equal in height peaks, between which a depression is visible.
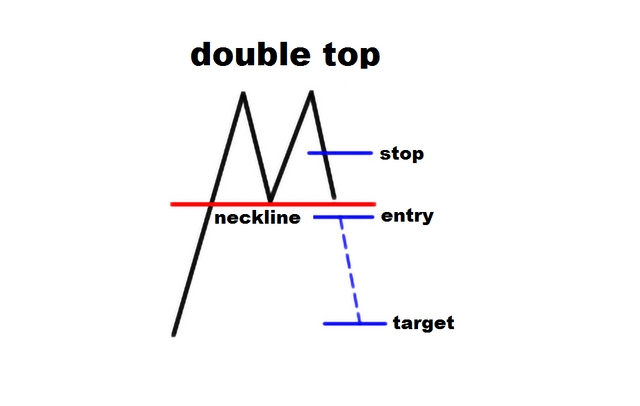
In the diagram above, blue indicates the reference points for entering the trade, the purpose of the price movement, and the approximate location of the stop-loss order for marginal trade supporters.
The reliability of this pattern is proportional to the size of the timeframe. In other words, the "Double Top" on the fifteen-minute chart is less reliable than the same figure that was formed over days or weeks.
Confirmation of the trend change in this figure is the break through the price of the support line (highlighted in red).
The main points to consider are:
- This figure should be preceded by a stable and long upward trend;
- the tops of the figure create a resistance level (during the formation of them, an increase in the volume of trades is desirable);
- when forming a depression, the price reduction should be at least 10% (preferably against a background of a significant decrease in trading volumes); the price minimum of the cavity forms the level of support;
- both vertices should be approximately the same in height;
- after the formation of the second peak, the breaking of the support line should be accompanied by an increase in the volume of trades;
- after its penetration, the support line becomes resistance;
- the goal of the price movement is approximately equal to the distance from peaks of peaks to the support line;
- vertices should not be too close to each other (best when the second vertex is formed about a month after the first).
Head and shoulders . This is another pattern that marks the end of the bull trend and the beginning of the bears' dominance in the market.
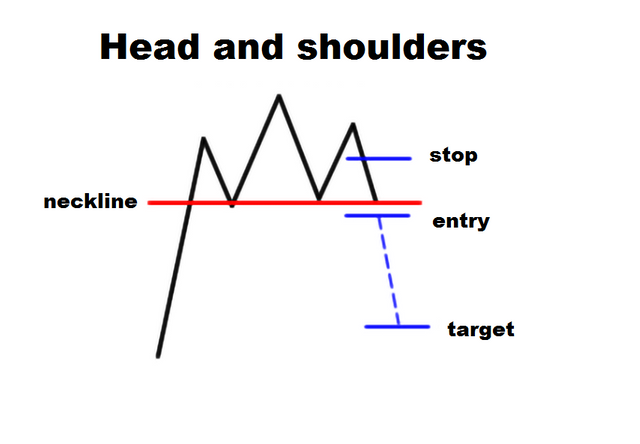
This figure consists of three successive peaks:
- middle - head - is the highest of them;
- lateral (left and right shoulder) are approximately equal in height.
The neck line (support) forms the minima after the first and second peaks.
Other features of the pattern:
- this figure (as, indeed, any other reversal pattern) must be preceded by a long and steady trend;
- in practice, the neck line is rarely strictly horizontal, so a slight inclination is allowed; while the direction of the slope also has significance - if it is pointing down, the bears are more determined than if the line were slightly upward;
- confirmation of this figure is the penetration of the neck line, accompanied by an increase in the volume of trades;
- an approximate goal for the price movement corresponds to the distance between the maximum of the head and the neck line.
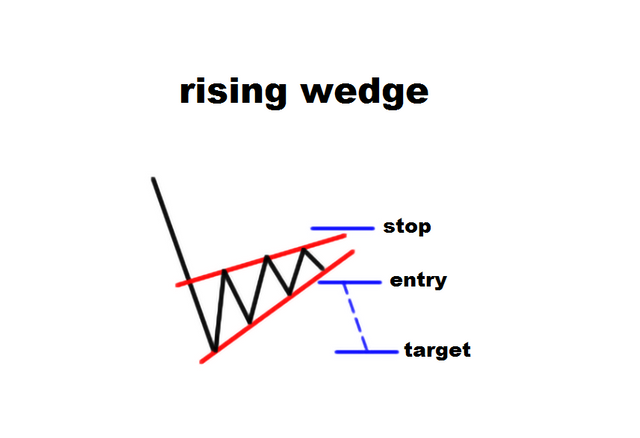
Ascending wedge . This figure also indicates the future dominance of bears. Schematically it looks like this:
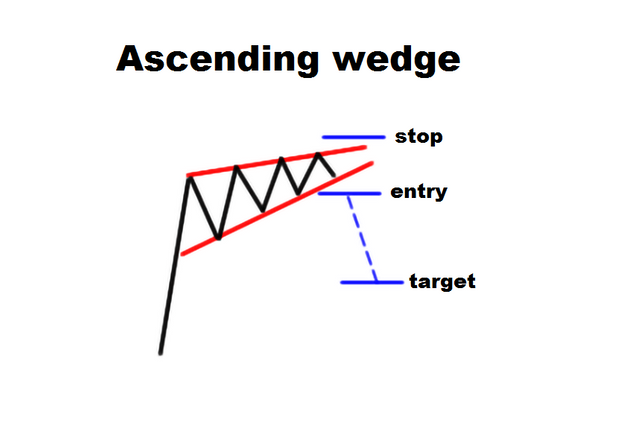
Note that the "Ascending Wedge" can also be formed on a downward trend. However, in this case it will be a figure of continuation of the trend.
Thus, regardless of the previous trend, the "Rising Wedge" is a bearish pattern. The signal for opening a short position is the penetration of the lower support line of this figure.
Pattern features:
- the reliability of the figure depends on the length of the period of its formation (the longer it is, the better);
- the upper resistance line and the lower support line should form a cone that tapers over time (preferably if consolidation is accompanied by a decrease in trading volumes);
- breaking through the bottom line of the wedge should be accompanied by a surge in trading volumes;
- the goal after working out this pattern is difficult to determine (for this you can use additional instruments of technical analysis, including Fibonacci levels).
Double bottom . This figure signals a possible rapid reversal of the bearish trend. This pattern looks like two successive cavities, roughly equal in depth:
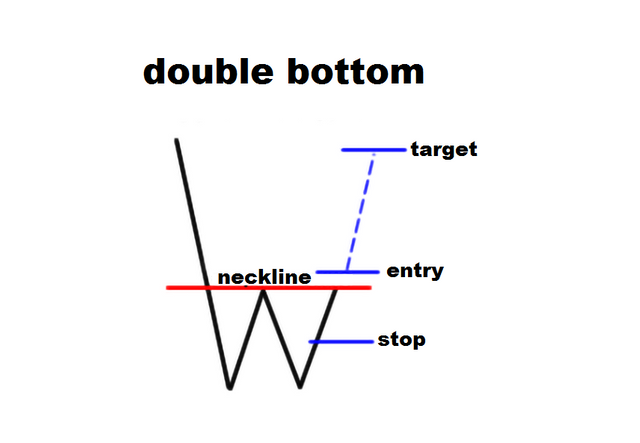
Pattern features:
- reliably works on relatively large timeframes;
- The figure should be preceded by a stable and long-term downtrend;
- the first depression is the minimum point of the current trend; its formation should be accompanied by an increase in trading volumes;
- the minimum of the first cavity may play a supporting role in the future;
- lifting after the first cavity should be above the minimum not less than 10%; The peak of this rise subsequently plays the role of resistance;
- it is desirable that the rise after the first cavity is accompanied by a decrease in trading volumes;
- The second depression should roughly coincide in depth with the first;
- growth after the second cavity should be accompanied by an increase in trading volumes (the appearance of gaps is an additional factor confirming a radical change in sentiment in the market);
- breaking through the resistance line finally confirms the formation of this figure TA, and it must necessarily be accompanied by an increase in the volume of trades;
- after breaking through the resistance, you can open a long position, whose goal is approximately equal to the distance between the minima of the troughs and the maximum between them;
- the formation of a reliable figure "Double bottom" occurs for several weeks or even months (note that this figure usually forms a little longer than the "Double top" considered above).
Inverted head and shoulders . This is a pattern that talks about the upcoming downward trend change to an upward trend. As you can see from the title, this figure is a mirror image of the figure "Head and shoulders" discussed above.
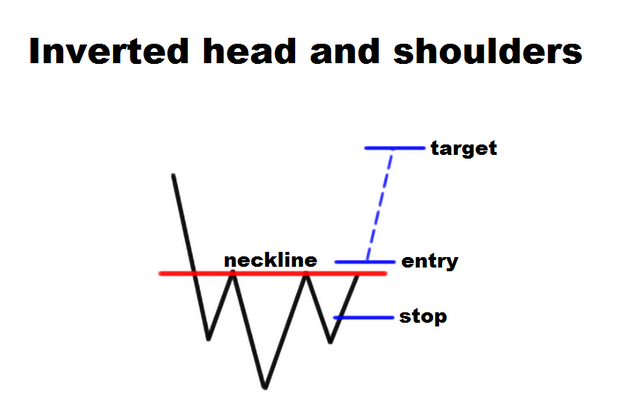
However, there is one difference - "The upside-down head and shoulders" to a much greater extent depends on the volume of trading.
Features of the figure:
- This pattern must be preceded by a pronounced downward trend;
- the extreme cavities (shoulders) should be approximately equal;
- the central cavity (head) must be the deepest;
- the neck line is formed from two points of correction maxima after the formation of the left shoulder and head;
- the neck line may have some inclination - if it is pointing up, the mood of the bulls is more determined;
- the final confirmation of the formation of the pattern occurs at the time of breaking through the neck line, which should be accompanied by an increase in trading volumes (preferably with price gaps);
- after its penetration, the neck line plays the role of a support level;
- the potential of an approximate future price movement is measured by the distance between the price minimum of the head and the neck line;
- supporters of margin trading can issue an order stop-loss approximately in the middle of the figure.
The falling wedge . Unlike the "Ascending Wedge" discussed above, this TA figure signals an impending bullish reversal.
In its form, this pattern is a cone tilted down:
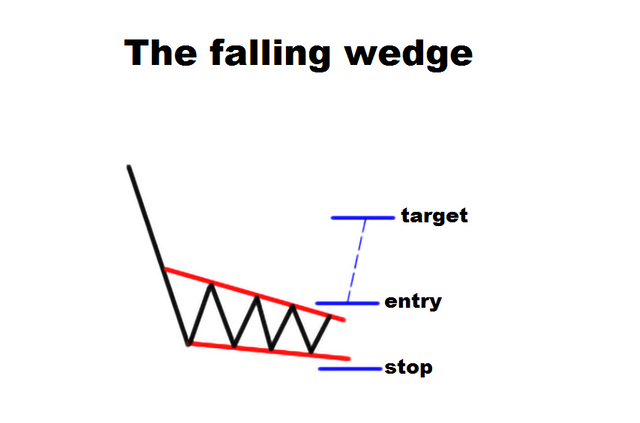
The emergence of a figure must be preceded by a pronounced downward trend. The exit of the price upwards from the narrowing range in the form of a cone gives a buy signal.
Other features of the pattern:
- the reliability of the figure "Falling Wedge" directly depends on the duration of its formation (the longer - the more reliable);\
- it is desirable that the upper resistance line of this pattern pass through two or three decreasing correction maximums;\
- the bottom line of support is also built through two, and preferably three, declining minima;\
- as the range is narrowing, the force of the downward movement should gradually fade, indicating a weakening of the sellers pressure;\
- Final confirmation of the pattern occurs at the moment of breaking through the resistance line, which must necessarily be accompanied by an increase in trading volumes.
However, sometimes the "Falling Wedge" is regarded by analysts as a signal about the continuation of the dominant trend. However, in this case such a wedge has some specific features:
- it should be formed on an ascending, not a bearish, trend;
- The inclination of the wedge should be directed in the opposite direction in relation to the main trend.
Patterns of trend continuation
As is clear from the name itself, such TA figures signal the continuation of the dominant trend. The most important component of such patterns is the period of consolidation, when the price moves within a relatively narrow or gradually narrowing range.
Against the background of such figures in the market there is a sort of respite. After a break through the price of the trading range, the trend usually continues.
To the patterns of continuation of the trend can include some modifications of triangles, wedges, as well as pennants.
Recall, the wedge can be viewed both as a reversal pattern, and as a figure of continuation of the trend (depending on the trend preceding this figure).
So, in the figure below, the "Falling Wedge" is depicted , before the formation of which the price was in a bullish trend:
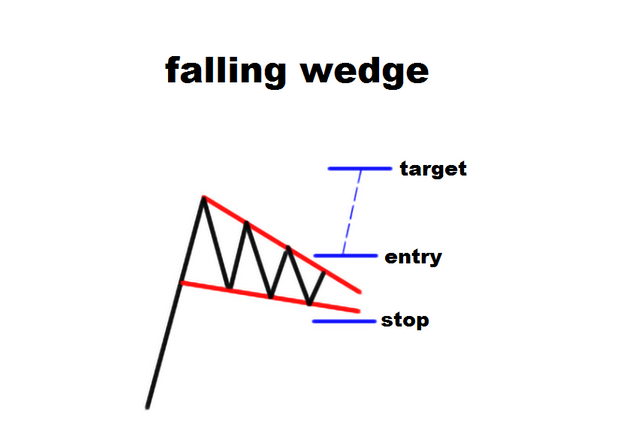
The diagram above shows how, after a period of some "breather" - corrective movement in the narrowing range - the price breaks the upper resistance line and resumes the uptrend.
Also, the pattern of the continuation of the trend is the "Rising Wedge" , which was preceded by a bearish trend:
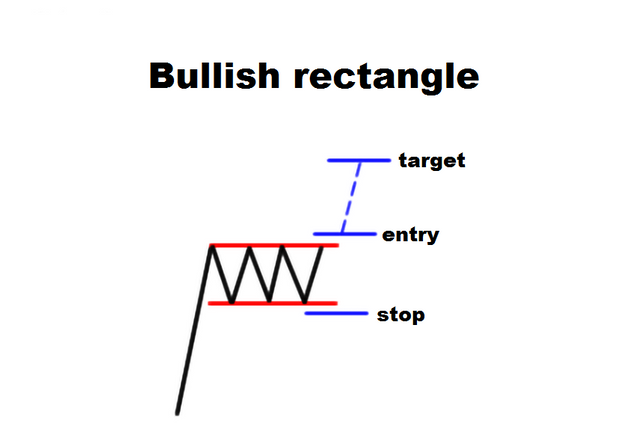
Rectangles are patterns of continuation of a trend. The name of these patterns is due to the fact that when they are formed, the price moves within the limits of a trading range limited by two horizontal lines, forming a rectangular figure.
The price consolidation period within the rectangle forms a series of approximately equal in height minima and maxima.
"Bull rectangle" indicates continuation of the uptrend after the end of the consolidation period:
"Bearish rectangle" , on the contrary, signals the resumption of a downward movement:
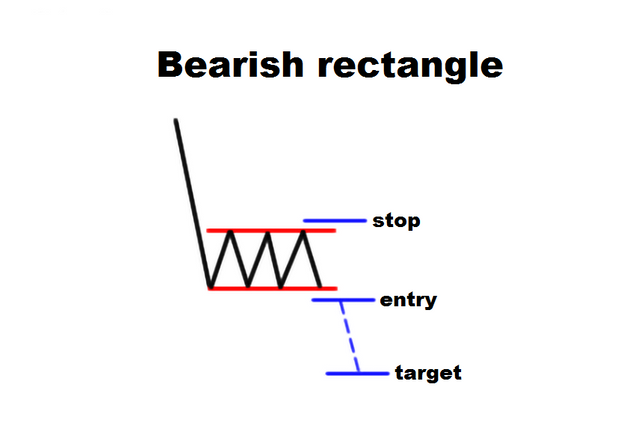
Other features of rectangles:
- The pattern should be preceded by a bullish or bearish trend lasting from a few weeks to months;
- if the trend preceding the rectangle lasted a very long time, then the probability of a cardinal change of the trend increases (in other words, sometimes rectangles can be reversal patterns);
- The minima and maxima forming a rectangle should be approximately equal in height;
- if during the consolidation there is a decline in trading volumes - there is a high probability of developing a bearish trend, and vice versa;
- break through the resistance line (exit from the consolidation zone) must be accompanied by a surge in trading volumes;
- The broken resistance level in the future becomes support for the forthcoming price corrections;
- the purpose of price movement after leaving the trading range is the distance between the support and resistance level (that is, the height of the rectangle).
Many supporters of short-term trading during the price movement in the trading range place orders for purchase just above the level of support for the rectangle, and orders for sale - just below the resistance line.
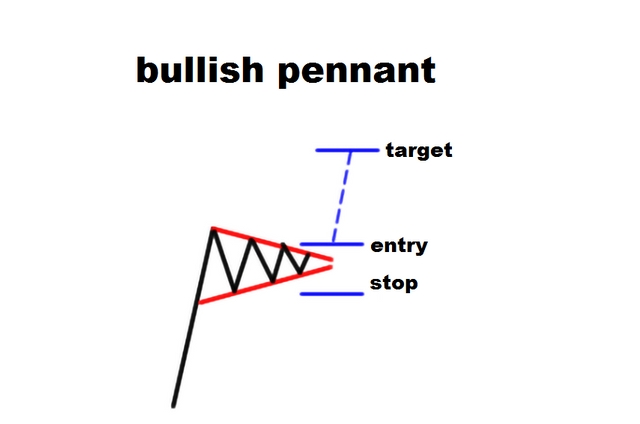
The pennant . This is another figure of continuation of the trend. A pennant may be "bullish" (formed during an uptrend):
... and "bearish" (emerging against a background of a downtrend):
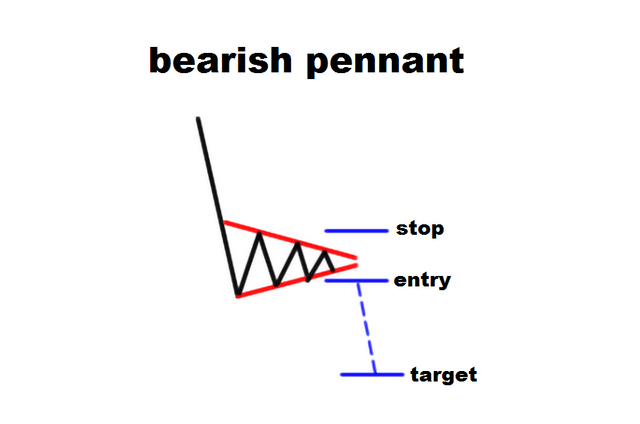
This figure is formed for a relatively short time. It, in fact, is a correction in the context of an actively developing trend.
Entry to the transaction is usually made after the breakdown of the resistance level. Often, the approximate purpose of the price is the distance approximately corresponding to the length of the flagpole of the pennant.
Triangles
These figures of technical analysis differ in some "cunning", and therefore are classified in a separate category. This is due to the fact that when they are formed it is quite difficult to unequivocally determine which direction the price pulse will follow - up or down. Among such figures, one can distinguish symmetrical, ascending and descending triangles, popular among many traders.
Important is the trend preceding the formation of the figure. So, if the ascending triangle was preceded by a bullish trend, then the trend is likely not to change its direction.
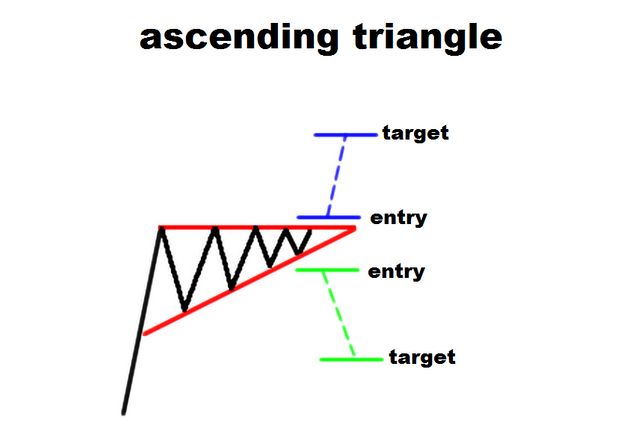
In the diagram above, the blue lines indicate the most likely scenario for the price movement after the formation of the "Ascending Triangle" figure . Green is a slightly less likely scenario, which should not be ruled out.
Thus, in most cases, the "Ascending Triangle" is considered by traders as a bullish pattern. The appearance of this figure usually indicates consolidation before the resumption of the upward price movement.
Other features of this figure:
- the upper level of resistance passes through two or more approximately equal in height local maximum;
- the reliability of the figure increases in proportion to the duration of the previous upward trend;
- the lower resistance line consists of at least two consecutive minima, each successive of which must be higher than the previous one;
- often in the formation of this figure, there is a decline in trading volumes;
- The moment of breaking through the resistance line should preferably be accompanied by an increase in trading volumes;
- after its penetration, the line of resistance of the figure becomes a support line;
- the approximate purpose of the further movement of the price usually corresponds to the width of the triangle formed during the ascending movement.
"Descending triangle" is often regarded by traders as a bearish pattern:
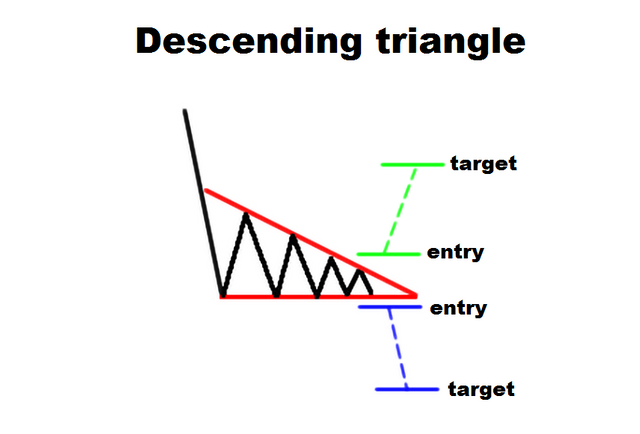
This pattern is formed on a downtrend, in most cases indicating its continuation. At the same time, as seen in the figure above, sometimes when you exit this figure, the price moves in the opposite direction.
In its characteristics, this figure is similar to the emerging "Ascending Triangle" formed on the bull trend and, in fact, is its mirror image.
The "symmetrical triangle" is a relatively neutral figure:
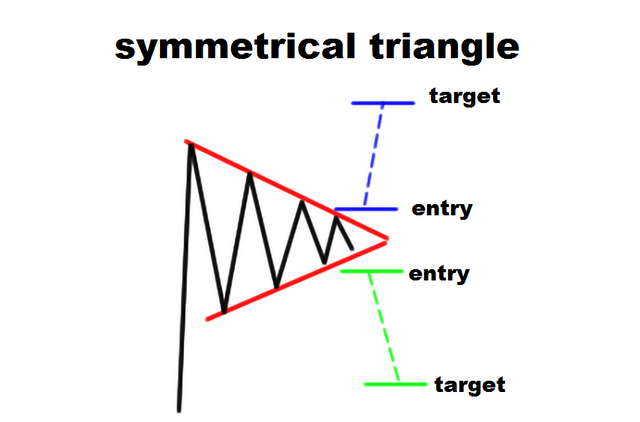
However, for example, if the formation of the "Symmetrical Triangle" was preceded by an upward trend, then this pattern will signal a high probability of continued bull domination in the market.
On the other hand, sometimes the result of the formation of the "Symmetric Triangle" may be a trend reversal. Consequently, the direction of breaking through the sides of the triangle serves as confirmation of the continuation of the trend or its reversal.
Other features of the figure:
- the triangle is considered reliable and signals a high probability of continuation of the trend, if before its formation the trend lasted for at least several weeks;
- to construct this figure, at least four points are needed - two for the resistance line, two for support (a more reliable triangle is formed by six points - three for the upper line, and three - for the lower line);
- As the triangle is formed and the range is narrowed, the trading volume should decrease;
- the approximate purpose of price movement is usually determined by the width of the triangle.
Traders should be extremely careful when working with a triangle, especially with a symmetrical one. Each time in the formation of such a figure, two possible scenarios of price movement should be taken into account at once.
If you enjoyed this, you might also enjoy these posts inspired by blockchain:
Hello josephfugata!
Congratulations! This post has been randomly Resteemed! For a chance to get more of your content resteemed join the Steem Engine Team