Understand What Displaced Moving Average Indicator
There are some things you will wish to adjust a trend to fit the line which DMA indicator is the perfect indicator you can use and adjust the line of your trend. In this post, the displaced Moving Average indicator is what we have discussed here.
| Displaced Moving Average |
|---|
DMA is the abbreviation for displaced Moving Average which is an indicator that helps traders, financial analysts, and business experts to forecast the market. As we have introduced earlier DMA is used for adjusting trend lines and forecasting price trends.

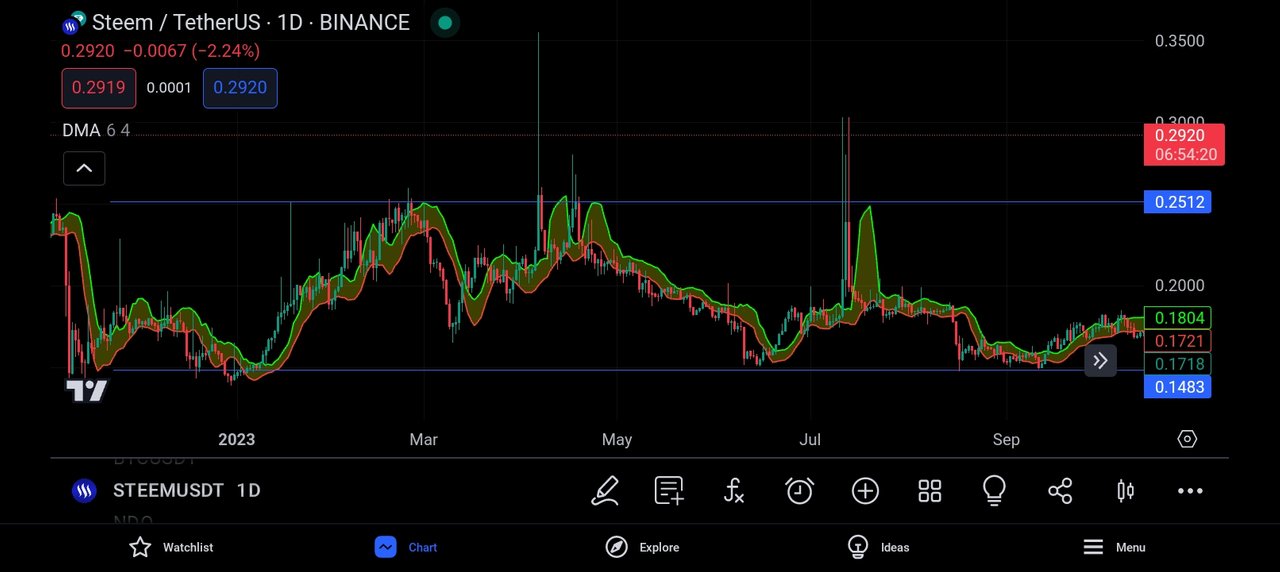
Tradingview App
As a crypto trader, you can use DMA to match with the moving average to know the price action of the underlying asset you wish to analyze. Also, DMA is used as a signal indicator for identifying the areas of support and resistance.
| DMA Trading Direction |
|---|

Tradingview App
When it comes to finding the potential price direction of an underlying asset, a displaced moving average can be used. For instance, when the price of the asset you are analyzing is above the moving average or the asset has at least surpassed the average, it is the asset is trading in an uptrend.

Tradingview App
On the other way round, when the price of the asset you are analyzing is moving through a DMA level, it means that there might likely be a trend reversal in the market. In a situation where you see the price of the asset you are analyzing is below the moving average, it means a downtrend is likely to occur, or it is the start of a downtrend.
| Identifying the areas of Support and Resistance |
|---|
As a trader, you can use displaced moving averages to identify the areas of support and resistance in the market. For instance, when the market is in an uptrend the MA can be aligned with the price of the asset in a manner that the pullback lows would be by the MA. To this when the price of the asset is closer to the moving average, it means that MA may likely show you the area of support level.
Tradingview App
As for a downtrend move, the DMA is automatically adjusted to be in line with pullback highs. At the top of a pullback, you can examine you will know if the displaced moving average has formed a resistance level. Should in case if have formed a resistance level, you should know that it is short trading the market has opportunity.
| Trading Signal |
|---|
In this indicator, a signal is generated when the price has crossed the moving average you need to know what is stated below.
Open a Long position when you see that the price has crossed above the DMA from below.
Open a Short position when you see that the price has crossed below the DMA.
| Formula for DMA |
|---|
Before you can be able to calculate DMA, you have to first calculate a simple moving average (SMA) or exponential moving average (EMA) which you can then move the moving average to either right or left across a fixed number of periods.
A move to the left will advance the moving average, with the displaced moving average being calculated many periods after the Dojo candle or correlating bar. If you move it to the right it will advance the moving average, with the displaced moving average being calculated for many periods aged of the candle or the correlating bar.
Conclusion
In this post, we have learned what "the displaced moving average indicator is and how it is used to adjust trend lines which you can also use to identify the areas of support and resistance. This post is solely ✍️ written for educational purposes and not investment advice.
https://x.com/AkwajiAfen/status/1764337236357616020?s=20
Note:- ✅
Regards,
@jueco