An Introduction to Z-Score Indicator
If you choose to you can call it the Z score or standard deviations. It is an indicator that millions of traders are using to measure the relationship of a set of arithmetic means of data. In this post, we are going to learn how to sport the z-score indicator and other things that have been discussed here.
| Z Score |
|---|
The best way that this indicator is known is for what the z-score measures and on the indicator the number of standard deviations is displayed you will get to see if the data is below or above the mean value of the set of data.
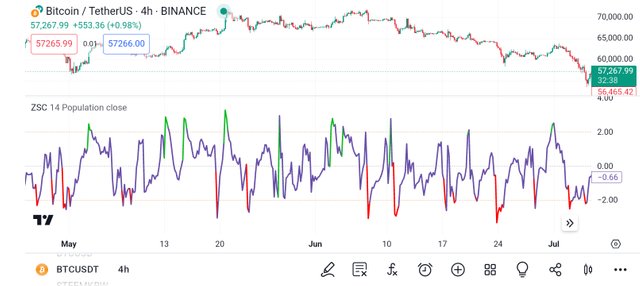
Tradingview
10 is the average period, whereas 20 is the Z score in the indicator, two lines are plotted below the chart as shown in the above screenshot. From the screenshot we have shared you can see the two famous lines which are green and red. Having said so;
The Z score is represented by the green line
The average is represented by the red line
Based on what we have discussed and shared it is now clear to us that the z-score indicator is an indicator that measures the difference between mean and price and divides whatever is gotten by standard deviation.
| Reading And Calculation |
|---|
The indicator is used to calculate the difference between the moving average and the price, which tells you about the trend strength of the market. The standard deviation for used for measuring the volatility of the market which is calculated by dividing the strength of the trend by the volatility.
As we have introduced earlier if you see a z score of 0 then you should know that it means the price of the asset is trading at its average price. To this, A positive z-score means that the price of the asset is trading above the average, whereas for a negative, the price of the asset is trading below the moving average.
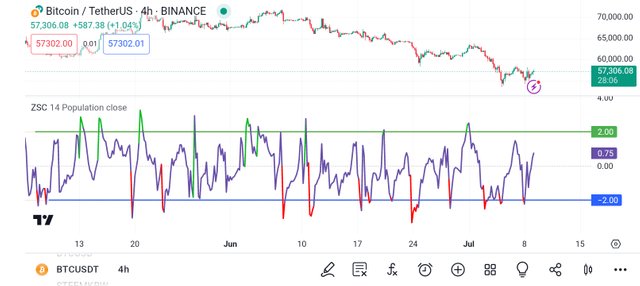
Tradingview
Furthermore, when you see a z score of plus two (+2) it means that the price of the asset is two standard deviations that is above the mean, whereas the opposite is -2 that you will see, which means the price of the asset is two standard deviations that is below the mean.
As we have so far discussed, the Z Score which we will keep repeating as time permits, the Z score measures accurately how many standard deviations have stayed below or above the mean data set.
Formula
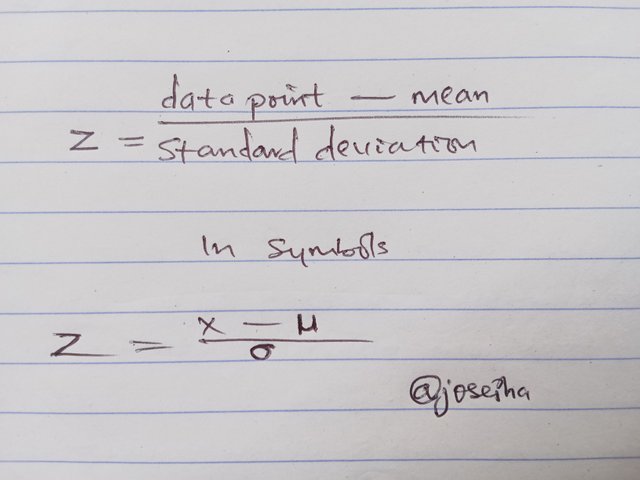
Going by the above formula you have to look out for the important point in the indicator which as we have earlier said we stated that:
Positive Z-Score means that the data point is above average
Negative Z-Score means that the data point is below average
Z-Score close to 0 means that the data point is close to the average
Disclaimer
Z-Score Indicator is what we have learned in this post which is an indicator that measures how many standard deviations have stayed above or below the mean data point. Note that this post is strictly prohibited as investment advice, but serves as educational content.
Thank you, friend!


I'm @steem.history, who is steem witness.
Thank you for witnessvoting for me.
please click it!
(Go to https://steemit.com/~witnesses and type fbslo at the bottom of the page)
The weight is reduced because of the lack of Voting Power. If you vote for me as a witness, you can get my little vote.
https://x.com/AkwajiAfen/status/1810581280502813166
Note:- ✅
Regards,
@jueco