An Introduction to Wedge Chart Patterns
When we talk about wedge chart patterns we mean how candlesticks are rising and falling in the market. In the financial markets when a chart pattern is rising it means the market is bullish, whereas when it is falling it means the market is bearish. This is the more reason why you have to understand what wedge chart patterns are:
| Wedge chart patterns |
|---|
Tradingview
According to what we have earlier introduced here, wedge patterns are of two different types which are:
Rising wedge chart
Falling Wedge chart
Let's take a look at them one after another.
| Rising Wedge |
|---|
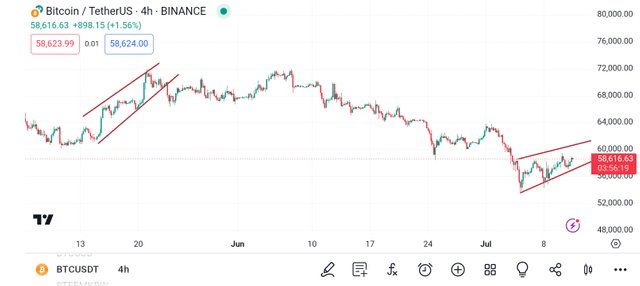
In a rising wedge, you will see the price of the asset on the chart will be rising upward which begins from a downward trend. This is formed when there is a consolidation between the resistance and upward-sloping line.
Tradingview
A rising wedge happens when the price of the asset makes many swings to new highs, which you will see the price wave of the asset getting smaller. However, you will see the price of the asset moving in an uptrend, and a slowdown in the upward movement as shown in the screenshot image above.
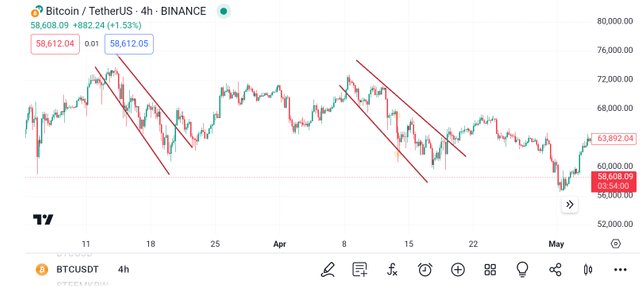
The rising wedge is also called the ascending wedge. When you see that the rising wedge happens in an uptrend, you will see a slowing momentum which means in the future the price will begin to fall. A drop can happen immediately if the price of the asset breaks below the rising wedge.
Tradingview
In an overall downtrend, where you get to see the rising wedge, you should know that the price of the asset you are analyzing is moving higher, thereby causing a downtrend movement.
| Falling Wedge |
|---|
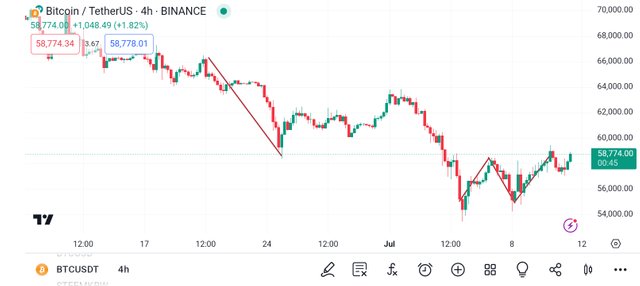
A falling wedge happens when the price of the asset makes many swings to new lows, which you will see the price wave of the asset getting smaller. However, you will see the price of the asset moving downtrend, and a slowdown in the upward movement as shown in the screenshot image below.
Tradingview
The swing low creates a downtrend movement where the price of the asset is waved to the downside. Downside momentum is a signal when the overall downtrend momentum is slowing down.
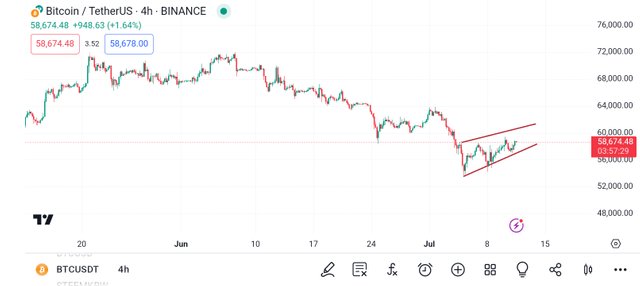
When a falling wedge happens in an overall uptrend it means that the price of the asset is lowering which is causing a pullback against the uptrend and the price of the asset movements are becoming smaller. To this, if the price of the asset breaks higher out of the pattern, the uptrend movement may likely continue.
The falling wedge is called the descending wedge which you will see the price of the asset marking many swings to new swing lows with a price wave becoming smaller as seen on the screenshot images we have shared
Disclaimer
We have just learned about wedge chart patterns which can help you perfect your trading skills and always put you in profit. It also helps you to spot continued trends and trend reversal. Note, that all that we have learned here should be treated as educational content and not as investment advice.
https://x.com/AkwajiAfen/status/1811372669557776735
Note:- ✅
Regards,
@jueco