An Introduction to Vortex Indicator
If your goal is to make money trading the financial markets like crypto, forex, or stock market then you need to have a deep understanding of at least ten technical analysis tools like "vortex indicator" and others. If you can understand technical analysis tools, then you will be able to analyze the market and make an informed decision that will help you avoid risk thereby maximizing your profits. Let's dive into what vertex indicator is.
| Vortex Indicator |
|---|
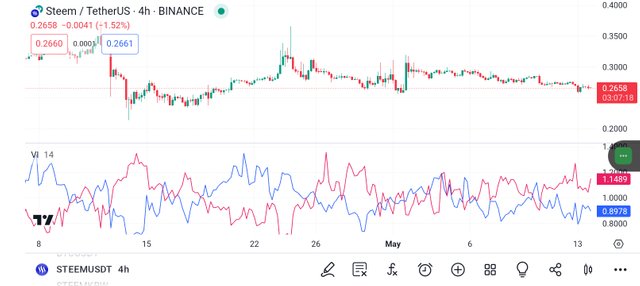
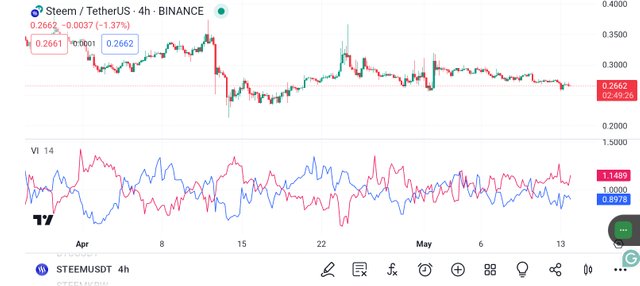
Before we begin, let's know the developer behind the vortex indicator which has become a popular indicator used by traders. Vortex was developed by two people who are; Douglas Siepman, and Etienne Botes as a tool to help traders identify price breakouts and trend reversal. The indicator consists of two different lines which you can see as shared in the screenshot below.
Tradingview
The line that is colored in blue is the positive line (VI+) of the vortex, whereas the line that is colored in red is the negative line (VI-) of the vortex indicator. It is these two lines which you have seen in the screenshot that measures the upward and downward movement of the price of the asset we have used in explaining vortex within a given period, which permits traders to be able to gauge the direction and strength of the market of the underlying asset.
In summary, of all what we have discussed above, it is now clear to us that the vortex indicator is a technical analysis tool like every other indicator, but special in its way as it helps traders to identify new or existing trends in the crypto market, forex, stock, the financial markets generally.
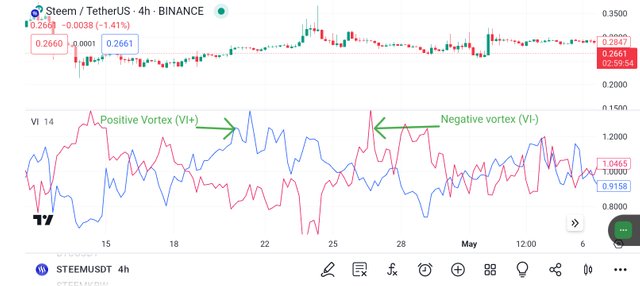
As we have discussed earlier vortex indicators have positive (VI+) and negative (VI-) lines the positive line represents an upward movement, while the negative (VI-) line represents a downward movement.
Tradingview
As a trader, when you see that the positive vortex (VI+) has crossed above the negative vortex (VI-), you should know that it is an indication of a potential upward movement, if you also see that the positive vortex (VI+) stay above the negative vortex (VI-) for long it means a positive price trend. In summary, a bullish trend reversal is what the crosses mean.
 Tradingview
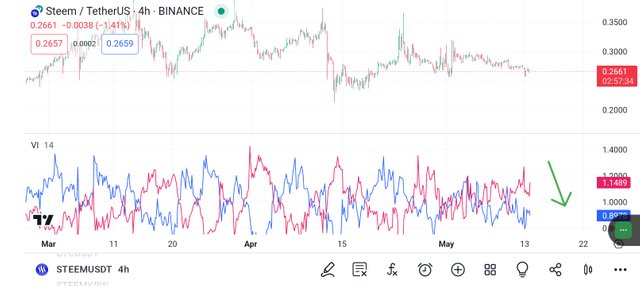
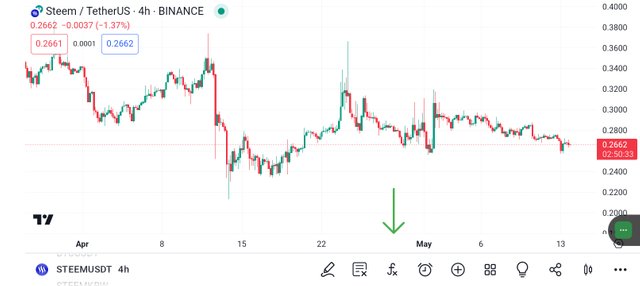
As for the negative vortex (VI-), you will see the negative vortex (VI-) crosses the positive (VI+) line which is an indication of a downward movement of a negative price trend. In summary, when the negative vortex (VI-) crosses above the positive (VI+) line, is an indication of a potential bearish trend reversal or potential breakout to the downward side.
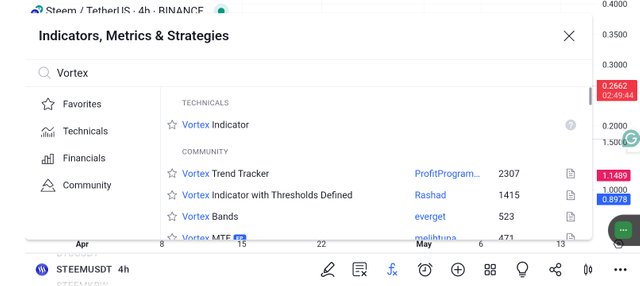
The same way you have been adding other indicators on Tradingview is also the same way of adding vortex indicator VI into the chart of any asset you want to analyze. The first thing you will need to do is to sign up for Tradingview if you haven't done so, but if you have already signed up, then open it and launch a chart.
 Tradingview
If you have launched a chart select, your crypto pairs, and then click ok on the symbol as shown in the screenshot.
 |  |
|---|
Tradingview
At the search bar, type "Vortex or in short VI and select it. Once you have selected it, go back to the chart, and you will see the vortex indicator added to your chart. You can reconfigure the settings to your preferred choice.
| Conclusion |
|---|
Today, we have so far learned what a Vortex Indicator is, which is an indicator for identifying new and existing trends. Note: this post is not financial or investment advice, but educational content that is written to educate you about the Vortex Indicator.
Thank you, friend!


I'm @steem.history, who is steem witness.
Thank you for witnessvoting for me.
please click it!
(Go to https://steemit.com/~witnesses and type fbslo at the bottom of the page)
The weight is reduced because of the lack of Voting Power. If you vote for me as a witness, you can get my little vote.
https://x.com/AkwajiAfen/status/1790209639532920957
Hello friend thanks for sharing the trading market information with us, In order for one to make money trading financial markets, one must have a deep understanding of technical analysis tools like the vortex indicator. Developed by Douglas Siepman and Etienne Botes, this tool helps identify price breakouts and trends. Positive and negative lines indicate upward and downward movements, aiding in decision-making for traders.
Note:- ✅
Regards,
@jueco