An Introduction to the Fisher Transform Indicator
The best you can do for yourself as a crypto or forex trader is to understand how to analyze the financial markets yourself. By analyzing the market you would be able to trend reversal, the direction of the market and so many things that would help you to become a winning trader.
The Fisher Transform Indicator is a good indicator you can use an identify potential trend reversal which we have so far discussed in this post.
| Fisher Transform |
|---|
Every indicator is developed by someone in the case of Fisher Transform, it was developed by John F. Ehlers who is best known for academic and trading excellence. Fisher Transform is an indicator that is developed to help traders, investors, financial analysts, and all those who have an interest in the financial markets to identify potential trend reversal and turning points in the market.
Tradingview App
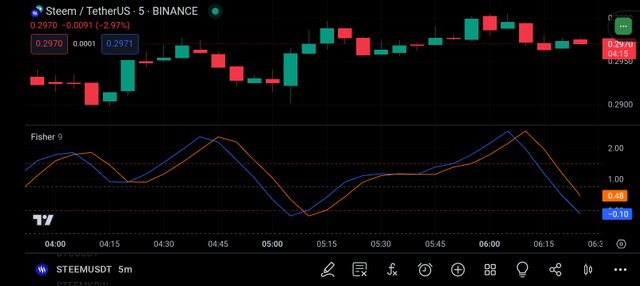
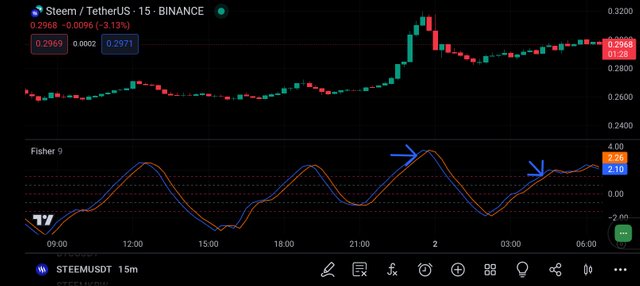
When you apply the Fisher Transform Indicator to your chart you will see that it is just like a stochastic oscillator and MACD indicator. Fisher Transform has two different lines that both move up and down following the price of the asset. The blue line is known as the Fisher while the orange color line is known as the Trigger which you all see in the screenshot image.
Tradingview App
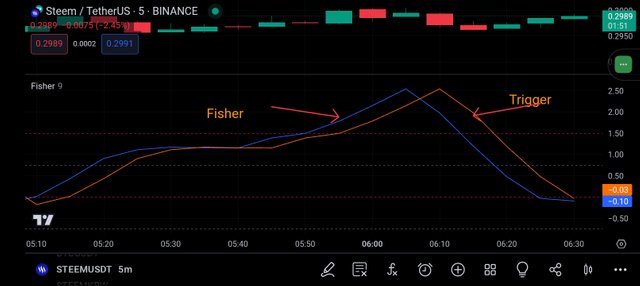
The lines that range between 1.5 and -1.5 are the horizontal lines. Just like you have been using other indicators, in Fisher Transform you have to look out for the area where the two lines intersect together and also where the trend is forming. Finally, as a trader, you can use the Fisher Transform to identify divergencies in the financial markets.
Fisher Transform is very simple to use all you need to do is to have a chart and apply it which you will then begin to see how the indicator is moving up or down. Most traders believe the indicator is more useful in a ranging market.
Although, the best way you can use Fisher Transform is to combine it with other indicators like parabolic SAR, or MA. Let's take a look at how we can identify divergencies, reversal, and crossover.
| Identifying Divergencies |
|---|
The best way of trading the financial markets using the Fisher Transform Indicator is for you to be able to identify divergencies. As you have seen from the chart of the STEEM/USDT pair, after the market ended with an upward trend, the market began consolidating.
Tradingview App
As the market started to consolidate the two lines (Fisher and Trigger) began to fall. The reason for the fall is an indication that the price of STEEM/USDT would decline.
| Bearish Reversal |
|---|
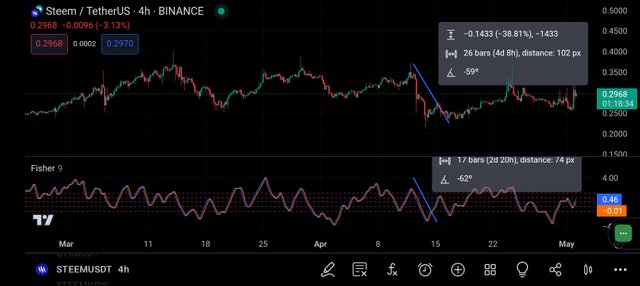
Looking at the below chart, in which we have applied Fisher Transform on a 4-hour timeframe of STEEM/USDT pair, I want you to take note of the blue line which is the Fisher line.
Tradingview App
From the above, you can see clearly how the STEEM/USDT pair began moving lower when the two lines made a bearish reversal. The price of the asset, began to decline until the Fisher and Trigger lines made a bullish divergence.
| Crossovers |
|---|
Tradingview App
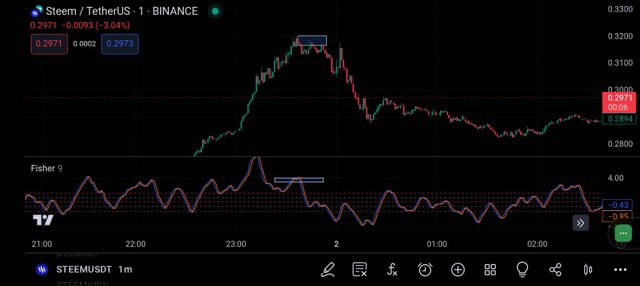
Looking at the above chart of the STEEM/USDT pair, you will see that at the time a bullish trend started the two lines (Fisher and Trigger) made a crossover where the blue line crosses the other line.
Conclusion
Today, we have so far learned what Fisher Transform Indicator is best used for identifying trend reversal. Note: this post is not investment advice, but educational content that is written to educate you about the Fisher Transform indicator.
Thank you, friend!


I'm @steem.history, who is steem witness.
Thank you for witnessvoting for me.
please click it!
(Go to https://steemit.com/~witnesses and type fbslo at the bottom of the page)
The weight is reduced because of the lack of Voting Power. If you vote for me as a witness, you can get my little vote.
https://x.com/AkwajiAfen/status/1785925326402458024
Note:- ✅
Regards,
@jueco