An Introduction to Mass Index Indicator
This is an interesting indicator that will help you to know about trend reversal. Before writing this post, someone came to my DM and said, Joe, please which Indicator is best to use to know trend reversal and as well to check the higher and lower price of an asset for a specific period, which was the mass Index Indicator that came to my mind first which is why I choose to introduce you also to it.
Mass Index Indicator
Before we get to dip into our discussion of the mass index indicator, it is good we know who founded the indicator which is no other person than Donald Dorsey in the year 1990s. This indicator has existed even before the launch of crypto which is to tell how long the financial markets have existed. Now by looking at the screenshot image below, it is the mass index indicator that has been added to the chart.
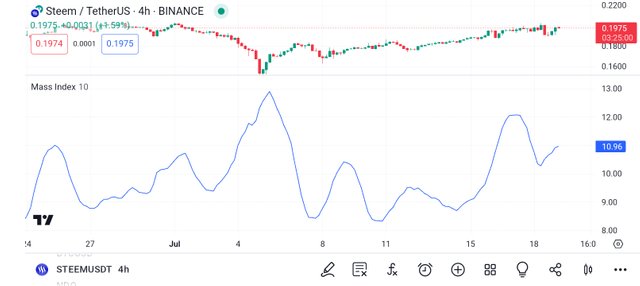
Tradingview
Now back to our discussion. The Mass Index indicator is just like every other technical analysis tool that you know of, but it's different because it is an indicator that is used to examine the range between the higher price and lower price of an asset over a certain period. As a trader, you can use this indicator to know how far an asset has moved up and down.
Calculation
You need to calculate the mass index indicator, and all that is needed for you to do is to follow the steps we have discussed in this post as detailed out below.
Single exponential moving average is what you are to calculate first. To this, 9 is the EMA period which you have to calculate the difference between the high price and low price.
The Double Exponential Moving Average is the second thing you are to calculate which is the difference between the high and the low.
The third thing you are to calculate is the EMA ratio by dividing the single Exponential Moving Average in the first step by the double EMA in step 2.
Finally, you are to calculate the mass index by calculating the 25-period sum of the Exponential Moving Average ratio.
Based on the much talked we have said, below is the summary of all of it.
MI = SUM (EMA (HIGH-LOW,9) / EMA (EMA(HIGH-LOW,9)9), N)
Readings
Remember we initially said that indicator is used to measure trend reversal thereby showing you the range between high and low, which according to the founder of the indicator 26 5, and 27 are the most key numbers in the indicator.
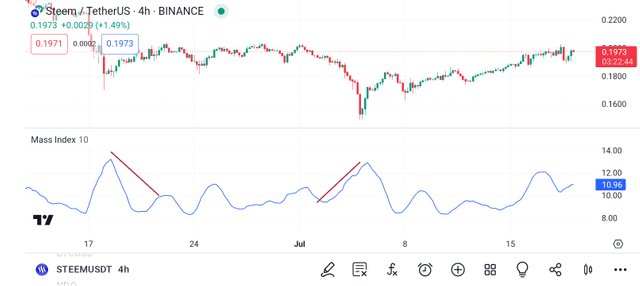
Tradingview
Having said so, in mass index indicator, a reversal happens when the indicator has climbed (move) above t7 and then falls 26.5 which the fall according to Dorsey means a "reversal bulge"
Also, when the indicator is below 26.5 it means the market volatility of the asset is low, whereas if it is 27 above it means the market volatility of the asset is high.
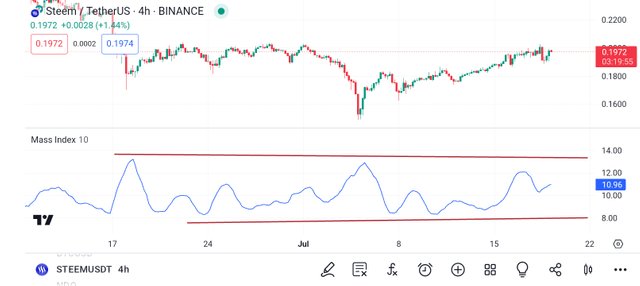
Tradingview
In addition to our discussion, a divergence occurs when the price of the asset and the mass index indicator move in opposite directions. A bullish divergence is when the price of the asset makes a lower low and the indicator makes a higher low, whereas a bearish divergence, is when the price of the asset makes a higher high and the indicator makes a lower high.
Disclaimer
Today we have been able to cover the mass index indicator to some extent and we believe you have learned something from this lesson. It is an indicator that is used to measure high and low as well as trend reversal. Please only treat whatever is said here as educational content and not investment advice.
https://x.com/AkwajiAfen/status/1814160918684598461
Note:- ✅
Regards,
@jueco