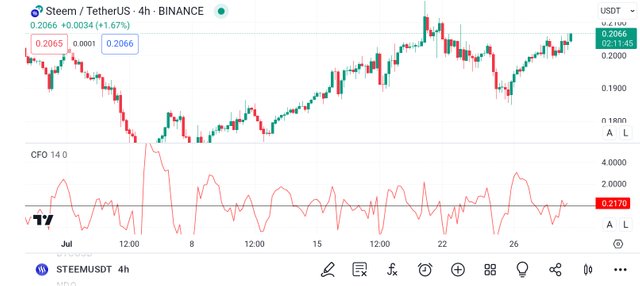
An introduction to Chande forecast oscillator Indicator
Friend today it is an indicator we are here to discuss, as we are all advancing into the bull market, it would be so nice to know the current market price of whatever asset that you want to invest in and the predicted price of the asset. Using the Chande forecast oscillator Indicator, you will be able to know the current price of STEEM and the predicted price of STEEM as predicted by a linear regression of the Chande forecast oscillator.
| Chande Forecast Oscillator |
|---|
The easy way to call the chande forecast oscillator is by putting in a three-letter word as CFO. The C stands for Change, the F stands for Forecast and finally the O stands for Oscillator.
The CFO is a technical indicator that was created by Tushar Chande who was known as one of the best technical analysts in the financial markets. The developer of CFO developed the Chande forecast oscillator to help traders predict the difference between the current price of an asset and the price of the asset that the indicator predicts by a linear regression.

Tradingview
Simply put, the CFO is a technical indicator that helps you to measure the difference between the current of a cryptocurrency and the price that is predicted by a linear regression.
Now if you look at the screenshot we have shared you will see that the CFO is plotted on a scale of 0 - 100, which simply means that a value that is above 50 is an indication that the price of an asset is above the price that has been predicted, and when it is below 50 it is an indication that the price of the asset is below the predicted price.
| Calculation |
|---|
The change forecast oscillator is calculated using the given formula below.
CFO = (Close - Linear Regression) / (Linear Regression) * 100
where:
Where:
Close = the closing price of the asset
Linear regression = the predicted price of the asset
| Readings |
|---|
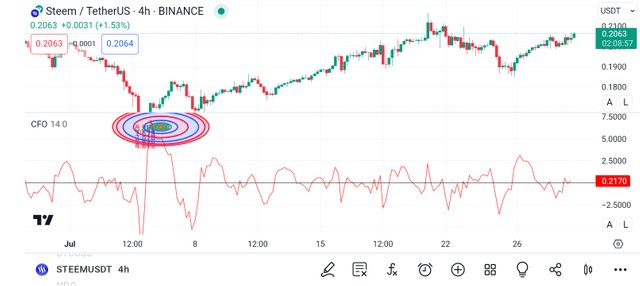
As a crypto or forex trader, you can use the CFO to identify the levels of overbought and oversold. To this, when you see that the Chande forecast oscillator is above 50, it means the market is at the level of overbought. Going by this it means the price of the asset is very high and it may likely decline.

Tradingview
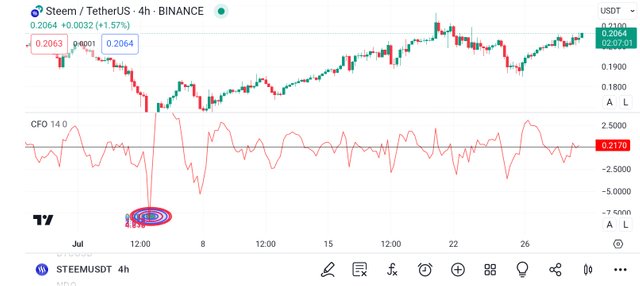
Also, when you see that the CFO is below 50, it means the market is at the level of oversold. Going by this it means the price of the asset is very low and may likely rise.

Tradingview
You can also use the CFO to Identify market trend reversals. To this, when you see that the CFO has crossed above 50, it means a bullish trend is about to be formed. On the other hand, when you see that the CFO has crossed below 50, it means that a bearish trend is about to form.
Now, besides the identification of overbought and oversold conditions and trend reversal we have discussed, you can use the CFO to identify other signals, which for better results you should combine the CFO with other indicators.
| Disclaimer |
|---|
The Chande forecast oscillator Indicator is what we have discussed here, we said it is an indicator that helps you to predict the difference between the current price and that of the linear regression. Please note that this post is written for educational purposes and not as investment advice.
Thank you, friend!


I'm @steem.history, who is steem witness.
Thank you for witnessvoting for me.
please click it!
(Go to https://steemit.com/~witnesses and type fbslo at the bottom of the page)
The weight is reduced because of the lack of Voting Power. If you vote for me as a witness, you can get my little vote.
https://x.com/AkwajiAfen/status/1817803007842467921
Note:- ✅
Regards,
@jueco