Big Data: Big Problem!
Communicating with Senior Developers and leading digital professionals on a daily basis; when I ask what online tools/information would best assist in their respective roles, many respond with a need for trending data on new and exciting libraries, frameworks and Open Source applications.
As the most effective technology is ever-changing for any given project, most Developers wish for a quick and easy means by which to review trending source-code, applications and advances in the enterprise space. Though not a complete solution to their everyday needs, this quick glimpse into what new technologies/integrated systems are trending – may highlight areas/directions for review, not previously considered.
For example, the growing use of mutable/immutable 'functional programming' techniques, has lead to the adoption of both the React.Js and Redux libraries, resulting in extremely efficient Document Object Model (DOM) operations, increased ease of writing Javascript functions, improved effectiveness for SEO and the ability to easily convert your build to Mobile application React Native.
Bringing trending technologies to the attention of my client base, would be helpful to them, in identifying respective applicants for future needs, so I put together a rudimentary model for an online tool that would pull data from every leading IT API, forum, chat-room and cross reference this with known IT tags from stack-overflow. This would then produce a BigData model of information, analysed computationally to reveal patterns, trends, and associations with congruent technologies.
So I began by acquiring all the known data-sets/tags, published questions and subsequent answers from Stack Over flow (which took 48 hours to complete) and started to analyse the data – BIG PROBLEM!
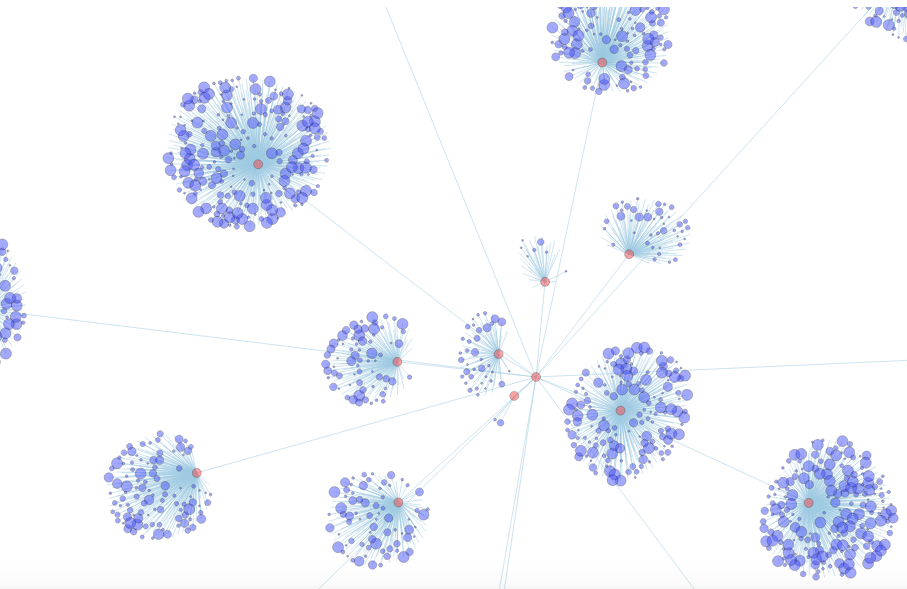
The data obtained was so vast, that even though I indexed this into smaller and smaller chunks/clusters the resulting information was far too large to illustrate effectively through any standard model i.e. pie chart, bar chart... I then moved on to cluster the data through another prevalent JS framework D3.JS; my vain attempts can be found here and as you may see, the model almost grinds to a halt.
This would not had been be too much of an issue, except this BigData sub-set was merely intended to make-up the indices for the predictive analytics section of the overall model, on which I would cross reference the core information via a variety of statistical techniques.
As the D3.JS library is based mainly on two-dimensional illustration, I opted for Three.JS and was surprised to find a more versatile source-code, a well-documented examples library and faster image processing times overall. My main aim is to provide both a one-time/glimpse illustration of the vast trending data collated, and to offer the ability to dig deeper in the data-set to visually assess these trends - with integrative systems in mind. I envisioned an holistic model with grouped data-sets, which could be expanded infinitely to reveal where and how this model is formed.
This model would need to be seamless, all encompassing and most importantly - be a valid source of information, for Junior techies to the accomplished/expert CxO. My draft model can be found here!
If this type of real-time trending data illustration would be of interest to you and / or you have a more seamless means by which to present this Big Data project, I'll be keen to here from you.