Japanese Candlestick Patterns -Steemit Crypto Academy Season -Homework Post for Task 10

It's with great pleasure to be here today that present my assignment post for one of your lectures. After reading the lecture notes and doing my personal research, I will present the solutions to the questions asked

Q1a : Explain the Japanese candlestick chart? (Original screenshot required).
Most of us who have participated in either the advanced courses or intermediate courses will by now know or have heard about the Japanese candlestick. For the sake of those who have heard but don’t know what it is am going to explain in detail what it is, your attention is much needed now.
Japanese candlestick, as the name suggests originates from Japan from a man named Mr. Muneshisa Homma in the early 70’s. Mr. Homma was a rice trader who buys and sells rice for a living, Mr. Homma observed that the price of rice was dependent on how many people wanted it (supply and demand) due to this he represented them with colors for easy identification. Uptil now people use his technique to short term predict the price of an asset.
The Japanese candlestick is one of the important technique most traders use to predict the price of an asset because the Japanese candlestick has four price points namely open, close, high, and low. So with this most traders will know the right time to opt into an investment of opt out of a trade.
How do we read the Japanese candlestick? When you are going to read the candlestick, you will need to get acquainted with three things the first is the color of the candlestick(which is either red or green at default settings), the wick (long pointer on the body of the candlestick) and the body of the candlestick.
When we talk about the color of the candlestick the red signifies a downtrend whiles the green signifies an uptrend. The wick of the candle either shows the highest price of the asset in the market or the lowest price of the market, whiles the body for instance you may see the wick taller than the body it indicates high volatility in the market.
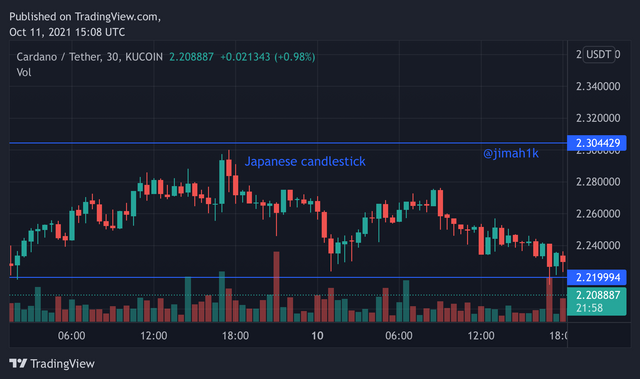
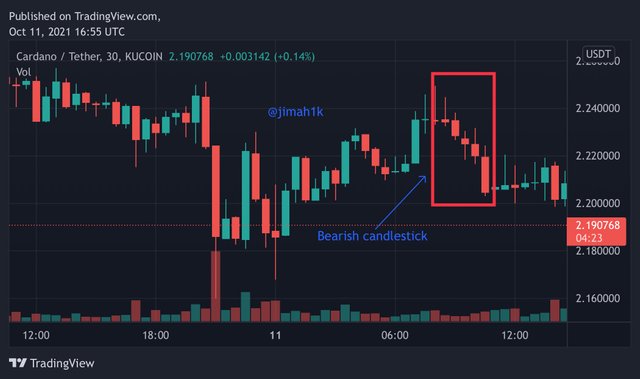
Below is a screenshot of a Japanese candlestick showing a chart of cardano/tether
In your own words, explain why the Japanese Candlestick chart is the most used in the financial market.
The Japanese candlestick is undoubtedly the most used by traders to make decisions. Let me present you some of the reason that make it very popular.
1 - Users can easily identify the highest price of an asset, the lowest price of an asset and also by looking at the body of the candlestick can also indicate the volatility of the market. Remember I said that the Japanese candlestick pictorially represents the price of the asset so at a glance you can easily spot the highest price of the asset or the lowest price of the asset.
2 - Bearing in mind all these, a trader or an investor can make good decisions based on the open price, closing price and so the trader will know that or be able to predict that the price of the asset will either go up or down.
3 - Another factor that makes this technique the most used technique is that it’s very compatible with other techniques. This means that to obtain the best results or be able to predict correctly the price of an asset some traders use the Japanese candlestick in addition to let’s say a vortex indicator or RSI indicator. This would help the trader to make good decisions.
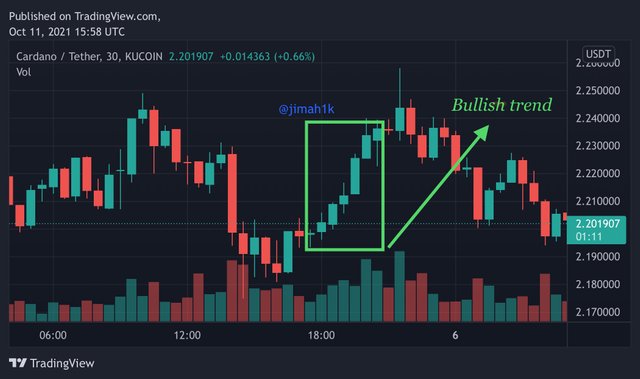
4 - The direction of the asset is very visible with the Japanese candlestick, the trader can easily spot a bullish trend or a bearish trend with this knowledge, we will know when you join a trade or opt out of a trade.
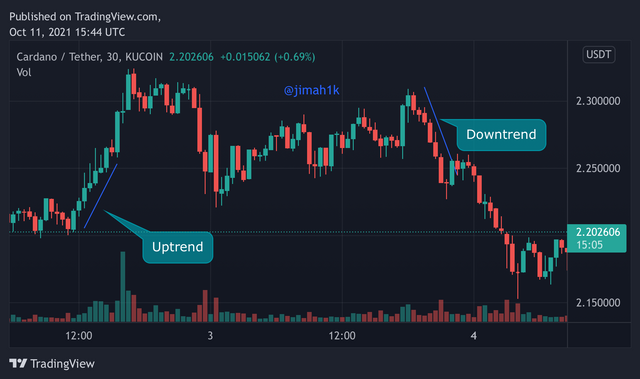
the Japanese candlestick clearly showing an uptrend and downtrend
Describe a bullish and a bearish candle. Also, explain its anatomy. (With original screenshot required)
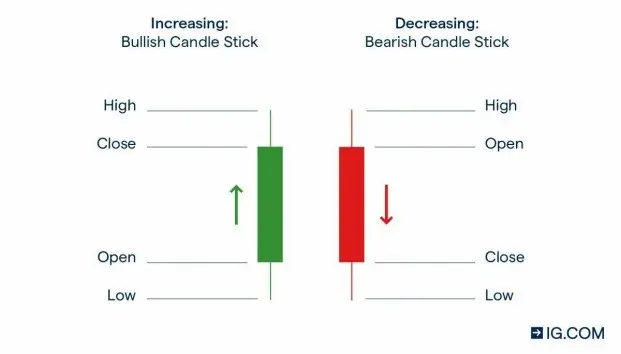
Bullish candlestick
Let’s start with the bullish candlestick as can be seen from the screenshot above you would notice that it is green in color at default but can be changed to a different color. A series of the bullish candlestick indicates the asset is in a continuous rise or can be termed as a bullish season
Bullish candlestick anatomy
From the screenshot above you will see that the bullish candlestick is made up of certain components namely; High, close, open and low. I will explain them so that we will know what they are to broaden our knowledge on Japanese candlestick.
High
This is clearly seen at the top of the candle’s body it refers to the highest price the asset attains over a given period of time sometimes a candle stick might not have a wick this means that the high price will be the same as
Closing price.
Close
Within the given time the price recorded last is called the closing price meaning it’s the last price of the asset. Usually located at the end of the wick.
Open
That’s the first price of the asset for a given period, this can either continue rising to reach the ‘high’ so that at the end of the period the closing price would also be recorded.
Low
This is clearly seen at the bottom of the candle’s body it refers to the lowest price the asset attains over a given period of time sometimes a candle stick might not have a wick this means that the low price will be the same as open price.
Bearish candlestick
The bearish candlestick is quite the opposite of the bullish candlestick. The default color for the bearish trend is red, a series of the bearish candlestick indicates a downtrend or the price of the asset is in continuous fall.
Bullish candlestick anatomy
From the screenshot above you will see that the bearish candlestick is made up of certain components namely; High, close, open and low. I will explain them so that we will know what they are to broaden our knowledge on Japanese candlestick.
High
This is clearly seen at the top of the candle’s body it refers to the highest price the asset attains over a given period of time in a downtrend. sometimes a candle stick might not have a wick this means that the high price will be the same as Closing price.
Close
Within the given time the price recorded last in the downtrend is called the closing price meaning it’s the last price of the asset at the given time. Usually located at the end of the wick.
Open
That’s the first price of the asset for a given period, this can either continue fall to reach the ‘low’ so that at the end of the period the closing price would also be recorded.
Low
This is clearly seen at the bottom of the candle’s body it refers to the lowest price the asset attains over a given period of time sometimes a candle stick might not have a wick this means that the low price will be the same as closing price.

Conclusion
What a great lecture this has been I have really learnt a lot the introduction of the Japanese candlestick has really helped traders to be able to read and predict the prices of assets. It is advised that to obtain the nest prediction results, you add certain indicators to confirm and since the Japanese candlestick is compatible with any indicator, this should be no problem. Thank you
