Volume Indicator - Crypto Academy / S4W2 - Homework Post for @kouba01

VOLUME INDICATOR
Volume Indicator is a very important technical indicator. It represents the quantity of an asset traded within a given period of time. It is visualized as a chart consisting of vertical bars and is usually found just below the candlestick charts.
Just like the candlesticks, the volume indicator bars are either colored green or red depending on the color of the corresponding candlestick.
There are also high and low bars, with the former representing larger volume traded within the time period and the latter representing smaller volume traded within the time period.
The use of trade volume in trading is very beneficial. It shows the intensity of trading activities at the market price and also highlights the level of liquidity. Some traders use it to test the strength of a price trend while some use it to determine entry and exit points.
Interestingly, these volumes can be denominated in different units e.g, the coin itself, USDT, BTC, etc
Another interesting characteristic of the volume indicator is that it is real time. Looking at the volume indicator, one can have an insight into the intensity of trading activity on a particular asset at the market price in real time.
SETTING UP THE VOLUME INDICATOR ON BINANCE WEB
I had to specify binance web as I couldn't find the settings for the mobile app.
That said, the volume indicator is very easy to set up. It's very possible that it is even included in your chart by default. If it's not though, not to worry, here's how to set it up.
Step 1
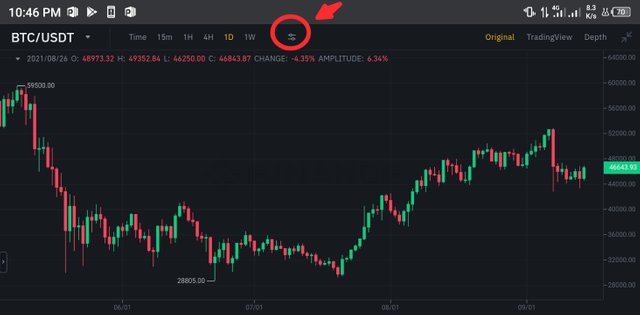
Open a chart on Binance web and click on the technical indicator icon as shown below
Step 2
In the ensuing dialogue box, click on 'Vol' to turn on the volume indicator
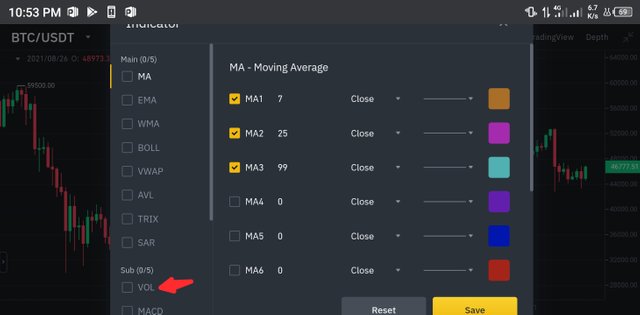
The volume indicator comes on as we'll see in the next step
Step 3
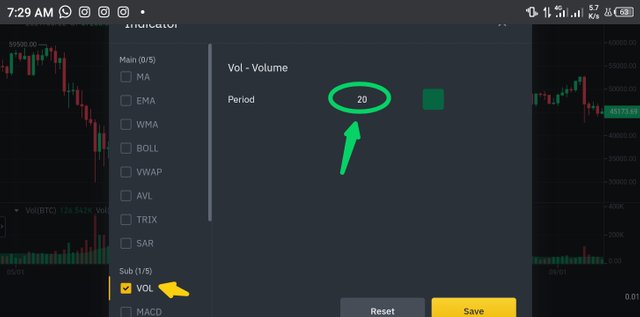
While the volume indicator is checked and turned on, you can decide to add a moving average to smoothen out random variations. To do this, just set a time period for the moving average
Click on save and you're done.
The bars (red arrow) are the volume indicator while the low opacity green area (green arrow) is the 20 period Moving Average.
Importance of Moving Average
Sometimes, the volume indicator can produce a bar at random that's significantly different from the others, maybe very high or very low. These bars if taken into consideration can distort results as they may be random spikes caused by probably a pump and dump.
Moving average, an indicator which plots on the average values of the past X periods, helps to filter out these random variations and gives the trader a more concise insight into the actual values.
VOLUME AND TREND
Volume is an important factor in determining trends, owing to the comprehensive relationship between volume and price trend. Volume as we know it, is the quantity traded, denominated in either price units or units of the assets traded.
VOLUME AND PRICE UPTREND
When the price is in an uptrend, it is as a result of sellers being more dominant and buyers feeling more pressure to buy. This usually results in large amounts of the assets being traded, meaning large volume.
During this uptrend however, there could be slight market corrections when the price seems to cut back for a short period before continuing it's upward movement.
What happens here is that buyers become hesitant and even if the sellers are ready to sell, the hesitation of the buyers means that the number of assets traded will reduce and so will the price until the sellers become hesitant and buyers are forced to succumb to sellers' price.
Volume Indicator Confirming a Price Uptrend
Thus, in an uptrend when the price is rising, the volume is usually high but when there is a price cut back during the uptrend, the volume is usually low.
When this happens, we say that the volume confirms the price uptrend.
VOLUME AND PRICE DOWNTREND
When the price is in an downtrend, it is as a result of buyers being more dominant and sellers feeling more pressure to sell. This usually results in large amounts of the assets being traded, meaning large volume.
During this downtrend however, there could be slight market corrections when the price seems to cut back for a short period before continuing it's downward movement.
What happens here is that sellers become hesitant and even if the buyers are ready to buy, the hesitation of the sellers means that the number of assets traded will reduce and the price will increase until the buyers become hesitant and sellers are forced to succumb to buyers' price.
Volume Indicator Confirming a Price Downtrend
Thus, in a downtrend when the price is falling, the volume is usually high but when there is a price cut back during the uptrend, the volume is usually low.
When this happens, we say that the volume confirms the price downtrend.
VOLUME AND TREND REVERSAL
In a trend, whenever the volume drops despite price moving in the direction of the trend it is an indication of a price reversal.
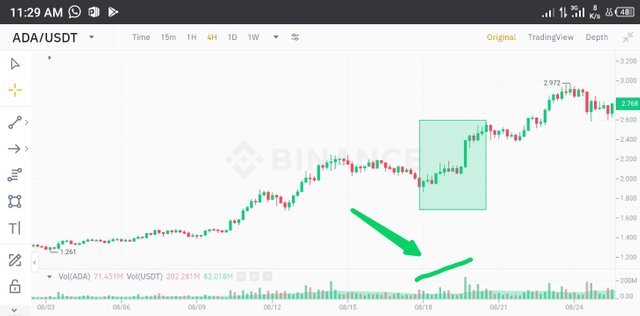
For a downtrend reversal to uptrend, if the volume begins to drop as the price drops, i.e, the red volume bars begin to form a series of reducing bars, then it is a sign of a downtrend reversal to uptrend
Downtrend Reversal to Uptrend
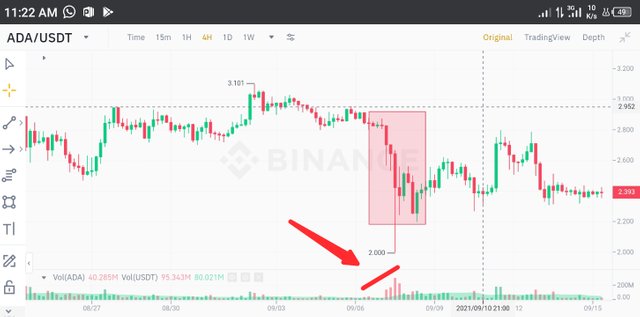
For an uptrend reversal to downtrend, if the volume begins to drop as the price rises, i.e, the green volume bars begin to form a series of reducing bars, then it is a sign of an uptrend reversal to downtrend
Uptrend Reversal to Downtrend
USING VOLUME TO CONFIRM A SIGNAL
We can confirm signals when we observe the volume as the price approaches support or resistance levels.
SUPPORT BREAKOUT
In confirming a support breakout, as the price approaches support levels, it is important to observe the trade volume for that period.
Usually, when price is reducing, low trade volumes will pressurize the price to return while high trade volumes will keep the price going in the trend direction.
Thus, if we identify an increase in volume or a high volume as price approaches a support level, it is a confirmation of a support breakout.
Support Breakout
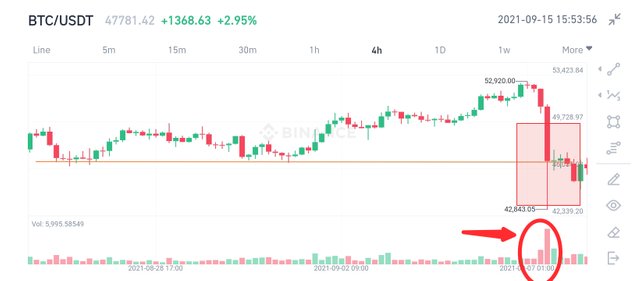
In the image above, observe that the increase in trade volume as price approached the support level confirmed the breakout signal.
RESISTANCE BREAKOUT
In confirming a resistance breakout, as the price approaches resistance levels, it is important to observe the trade volume for that period.
Usually, when price is increasing, low trade volumes will pressurize the price to return while high trade volumes will keep the price going in the increasing or uptrend direction.
Thus, if we identify an increase in volume or a high volume as price approaches a resistance level, it is a confirmation of a resistance breakout.
Resistance Breakout
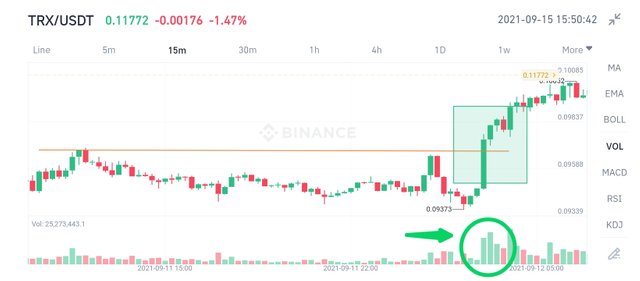
In the image above, observe that the increase in trade volume as price approached the resistance level confirmed the breakout signal.
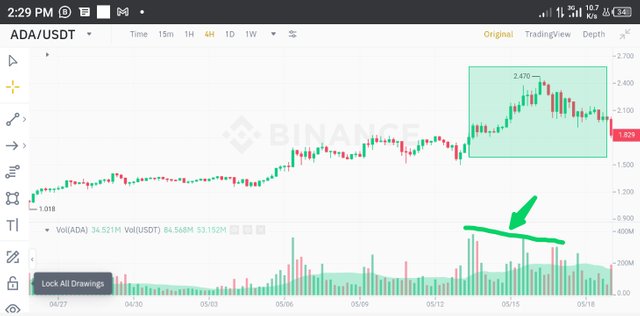
VOLUME AND PRICE EVOLUTION
Volume has a close relationship with price. Sometimes, we see activities increasing in an asset, sellers and buyers are meeting buy and sell orders respectively. This leads to an increase in trade volume for successive periods.
This increase is sometimes preceded by an increase in price or happens just as price also increases. Whenever there's a price increase and it is followed spontaneously or simultaneously by an increase in volume, we say that the volume reflects the price increase.
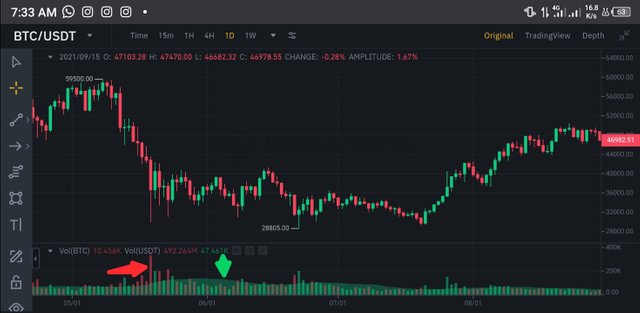
In the image above, we see an increase in price and at the same time, volume records a significant increase, reflecting the increase in price.
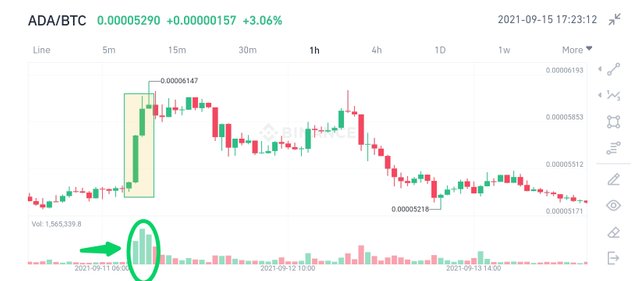
PRICE ANTICIPATION
Sometimes, we don't see the price rise, but we see the volume rise. Shortly after the rise in volume we see a corresponding rise in price.
In this case, we say that the volume anticipated the price and rose to precede the rise in price.
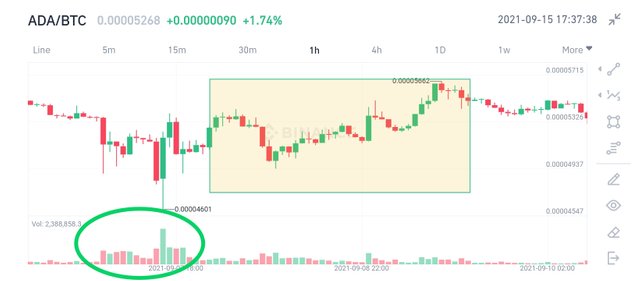
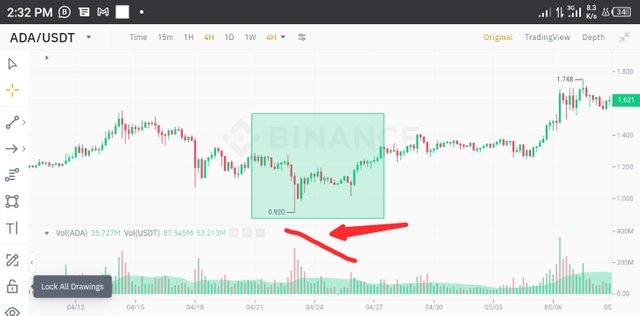
In the image above, price were dropping and the volume was low. Suddenly, volume increases significantly but price does not initially. After some time however, price also increases.
SHOULD VOLUME INDICATOR BE USED ALONE?
I don't even advise using an elaborate indicator like the ichimoku kinko hyo alone, not to talk of the volume or any other singular indicator.
Truth is, in trading, there are signals and there are confirmations. An indicator can give you a signal but you will need another indicator for confirmation.
It is not safe to trade a signal without confirmation the signal could be false and the trader would be deceived. Preferably, a signal should be confirmed before it is applied.
It's on this premise that I strongly recommend trading the volume indicator alongside other relevant indicator like support, resistance, moving averages, trendlines, etc.
UTILITY OF VOLUME INDICATORS
Traders who wish to use volume indicators to garnish their trading experience are spoiled for options. There are a host of different volume indicator one can apply. I'll just be talking about one of them though, one that it's name catches my fancy.
CHAIKIN MONEY FLOW
Chaikin money flow (CMF) is an indicator that measures the volume of money inflow and outflow over a given period of time. That about explains the name of the Indicator. Chaikin - the inventor, money flow - what it indicates.
CMF totals the money flow for a look-back period. This period is usually set by the user. Popular among look-back periods for CMF is 20 and 21 periods. So for a 20 days look-back period, the CMF totals the money flow for the past 20 days.
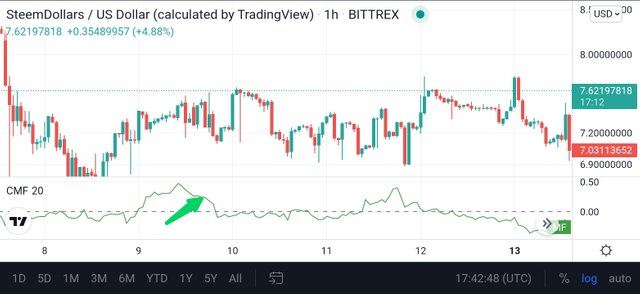
The CMF values ranges from 1 to -1 with 0 as the center line. When the value is above 0, it indicates that there's strength in the current market price. However, below 0, it indicates weakness in The current market price.
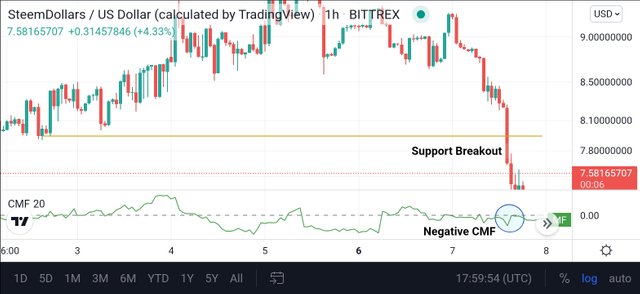
The CMF can be used to confirm price breakouts. If the price breaks above a strong resistance level and the CMF at that point becomes positive, then it shows a confirmation of the resistance breakout. If the price breaks below a strong support level and the CMF at that point becomes negative, then it shows a confirmation of the support breakout.
CONCLUSION
Trade volume is a very import metrics to consider when trading crypto, hence the volume indicator is so important in crypto trading. Volume is closely related to price and can sometimes confirm price movement in a bullish and bearish trend.
The volume indicator is available as a bar chart below the candlestick chart and is also colored red and green like the candlesticks. The implications of the volume bar colors are exactly similar with the candlestick. So for a red candle, you'll have a red bar, so also for a green candle, you'll have a green bar.
The colors just represents the position of the closing price for the period, if it's above (green) or below (red) the opening price for the same period.
The volume indicator, just like any other indicator, should not be used alone. This can be misleading. It is preferred that the volume indicator be used together with other indicators like MACD, trendlines, support and resistance, etc.
Thanks for reading.
Cc:
@kouba01
Hi @jehoshua-shey
Thanks for participating in the Steemit Crypto Academy
Feedback
This is excellently done. Thanks for demonstrating such a clear and well detailed understanding of trading with the Volume indicator.
Total| 10/10
Thank you so much for your comments and for checking my post. I'm grateful.