Dow Theory - Crypto Academy / S6W4- Homework Post for @reminiscence01

Q.1. Explain your Understanding of the Dow Jones Theory. Do you think Dow Jones Theory is Important in technical analysis?
The Dow theory was postulated by Charles H. Dow in 1897. Charles was of the opinion (as was evident in his theory) that the stock market (as there was no crypto then) was a function of what was happening to business in an economy. The market activities, economic sensitive news, supply and demand all had a toll on where price was headed at any point in time.
The Dow's theory was based on a fact that the market price takes into account all the available information relating to business in an economy. Thus if there's a competitive advantage for a stock, a pronounced profit, high level of improvement, highly commendable managerial inputs, even etc. They are all reflected in the price of that stock.
Through his theory, Dow opined that markets experience major trends which could be upwards or downwards and within any of these trends, there could be an opposite trend temporarily. For instance, the market can experience an uptrend, within which prices start to go up. Within this uptrend, there could be a subtrend in the form of a pullback. It could also be a rally during a downtrend.
The major trends according to him are in three phases. For an uptrend, the phases are accumulation, public participation, and excess phases. While for a downtrend, the phases are distribution, public participation, and panic phases.
Charles believed that when price proceeds in the direction of the major trend, trade volumes will increase and the major trend will continue until there's a market reversal.
It is worthy of note that a subtrend in a major trend can be mistaken to be a market reversal. Caution is advised in this regard. It is imperative to carefully ascertain if a pullback during an uptrend is a subtrend or a reversal or if a rally during a downtrend is a reversal or merely a subtrend.
IS DOW THEORY IMPORTANT IN TECHNICAL ANALYSIS?
Absolutely. Dow theory tells you that the news as well as everything going on in the business sphere affects price. This basically advises fundamental analysis as a key component of price prediction.
Technically, with the Dow theory, we can now see the market in different major trends - uptrend and downtrend. We also know that each of the trends could have a subtrend. Thus we apply caution and not conclude that price going against a trend is a reversal.
With the Dow theory, we also can tell the phases of a trend. This helps in technical analysis as we can identify when a trend is still in its early stage at which point it is profitable to ride the trend. We can also identify when the trend is nearing its end at which point we should be more careful with our trading decisions if we seek to ride the trend.
Q.2. In your own words, explain the psychology behind the Accumulation and Distribution phases of the market. (Screenshots required).
ACCUMULATION
Accumulation phase in a market cycle is a period when price ranges during a downtrend and is then followed by an upward breakout. What happens here is that as price drops to a point during a downtrend, large volume traders begin to close their sell positions which they must have opened at the earlier stages of the downtrend. These traders start buying back the asset in large volumes as usual.
Buying back large volumes create some buying pressure in the market and this pushes the price up momentarily. This run is not sustainable as it is a function of large volume traders accumulation. Retail traders meanwhile are already panic selling as they fear further price crash during the downtrend and this provides the liquidity for the large volume traders to mop up.
Consider the BTCUSDT 4H chart below
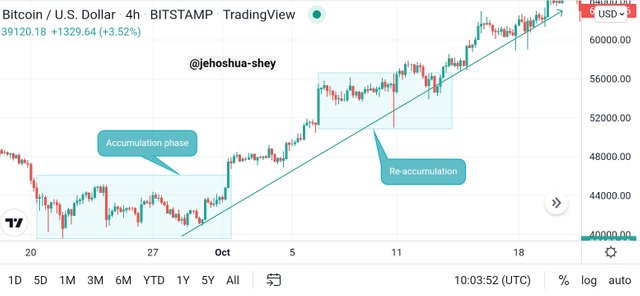
We see the price on a downtrend but then, it begins to range with higher lows and multiple bottoms. During this period, panic sellers who entered the market earlier are already selling, creating liquidity for the large volume traders to mop up. These large volume traders take up this liquidity buy buying the asset. By doing this, they're closing their sell positions which they opened when the price was higher earlier in the downtrend and taking profit.
The buying of the asset in large volumes by these traders cause the price to range. After they have bought enough, they wait for the inevitable. Panic sellers would have at this point sold off most or all of their assets, leaving the large volume traders with a bulk of these assets.
As the initial buying by the large volume traders push prices up, there's a buying pressure created that continues to push prices up when large volume traders have taken up most of the liquidity. By this time, not much is up for sale in the market and demand outweighs supply. The effect is the breakout to the upside which we see at the end of the accumulation period.
This can continue to a point where these large volume traders begin to take advantage of the buying pressure created to take some profits. They come in with large sell volumes and this halts the market trend temporarily as price proceeds in a range. After sometime, panic sellers help these large volume traders to re-accumulate again and the trend continues till distribution.
DISTRIBUTION
Distribution phase in a market cycle is a period when price ranges during an uptrend and is then followed by a downward breakout. What happens here is that as price rises to a point during an uptrend, large volume traders begin to close their buy positions which they must have opened at the earlier stages of the uptrend during accumulation and/or re-accumulation. These traders start selling off the asset in large volumes as usual.
Selling off large volumes create some selling pressure in the market and this pushes the price down momentarily. This pullback is not sustainable as it is a function of large volume traders distribution. Retail traders meanwhile are already FOMO-ing into the market as they fear missing further price rise during the uptrend and this provides the liquidity for the large volume traders to mop up.
Consider the OGNUSDT 1H chart below
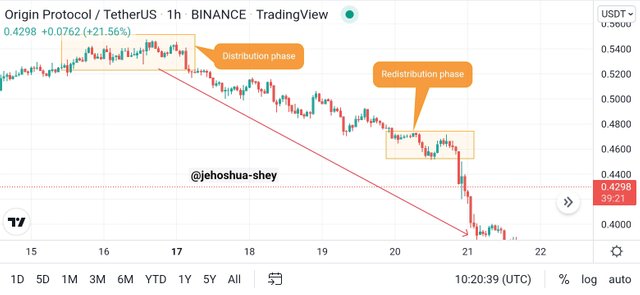
We see the price on an uptrend but then, it begins to range with lower highs and multiple tops. During this period, panic buyers who entered the bullish market later are already buying, creating liquidity for the large volume traders to mop up. These large volume traders take up this liquidity buy selling the asset. By doing this, they're closing their buy positions which they opened when the price was lower earlier in the uptrend and taking profit.
The selling of the asset in large volumes by these traders cause the price to range. After they have sold enough, they wait for the inevitable. Panic buyers would have at this point exhausted their purchasing power buying the asset, leaving the large volume traders with a lot of the purchasing power.
As the initial selling by the large volume traders force prices down, there's a selling pressure created that continues to force prices downward when large volume traders have sold off so much of their assets. By this time, other traders begin to sell off and since there's not so much purchasing power in the market, supply outweighs demand. The effect is the breakout to the downside which we see at the end of the distribution period.
This can continue to a point where these large volume traders begin to take advantage of the selling pressure created to take some profits. They come in with large buy volumes and this halts the market trend temporarily as price proceeds in a range. After sometime, panic buyers who are anticipating a reversal help these large volume traders to redistribute again and the trend continues till accumulation.
Q.3. Explain the 3 phases of the market and how they can be identified on the chart.
The market can generally be described in three phases with respect to price movement. It is either in an uptrend, in a downtrend, or in a range. Identify each of these phases can be done with the aid of indicators, trend lines or most effectively, market structure. Indicators usually lag prices as they are a calculation based on price (i.e. there has to be price before there can be an indication).
Using market structure however, we find not only an easier way but also a most reliable way of determining the phases of a market. Market structure deals with price directly, it's the path price takes and so offers better insights into price direction.
UPTREND
An uptrend is a period in the market characterized by price forming higher highs and higher lows. Here, price proceeds upwards with occasional pullbacks but highs formed during these pullbacks are usually higher than the previous one. The same is true for the lows formed. Each low formed is usually higher than the previous one, meaning that on aggregate, price is progressing upwards.
Consider the ETHUSDT 1H chart below
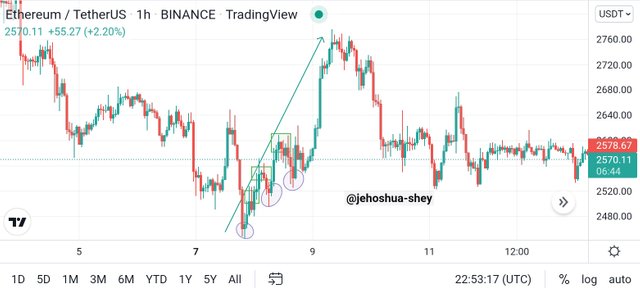
From the chart above, we see a period where price rebounds from a down trend and begins to form higher highs and higher lows. The higher highs are highlighted with a rectangle while the higher lows are highlighted with a circle.
DOWNTREND
A downtrend is a period in the market characterized by price forming lower highs and lower lows. Here, price proceeds downwards with occasional pullbacks but highs formed during these pullbacks are usually lower than the previous one. The same is true for the lows formed. Each low formed is usually lower than the previous one, meaning that on aggregate, price is progressing downwards.
Consider the ETHUSDT 1H chart below
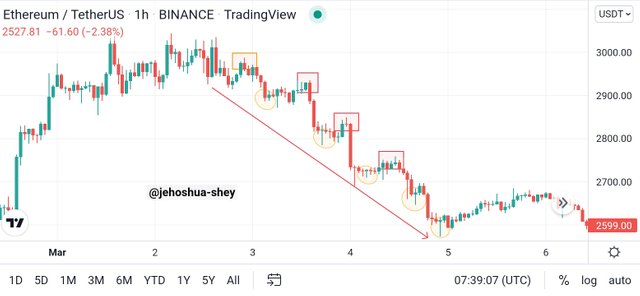
From the chart above, we see a period where price rebounds from an uptrend and begins to form lower highs and lower lows. The lower highs are highlighted with a rectangle while the lower lows are highlighted with a circle.
RANGING MARKET
Sometimes, the market is proceeding in a manner where there's a mixture of higher highs and lower highs and/or a mixture of higher lows and lower lows. This market is neither in an uptrend or a down trend. It's just trading upwards and downwards. A close look at this price pattern will reveal that price actually oscillates between an upper and a lower price threshold. In this scenario, the price is said to be ranging between those thresholds.
The percentage difference between these thresholds could be small or they could be big and the ranging could last for a short time or a longer time. Also, during a ranging market, one of accumulation, re-accumulation, distribution, or redistribution could be going on. When the difference between the price thresholds is large, we say there's high price volatility and there's a good opportunity for scalping.
Consider the RUNEUSDT 30 mins chart below
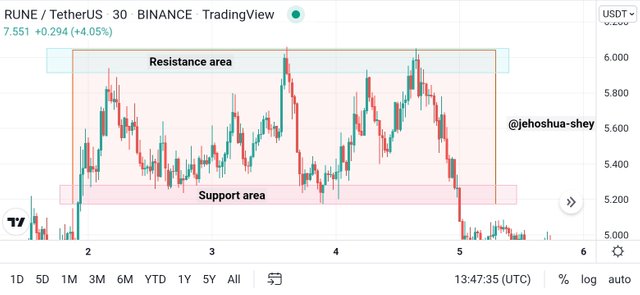
From the image above, we see price rise up to the resistance area a number of times and falls back to the support area during the same period. It is more of an up and down movement than an uptrend or a downtrend. The resistance area is around $5.915 - $6.05 while the support area is around $5.17 - $5.28. Hence, we say that price is trading within this range.
In this ranging market, we have $5.98 as the average resistance level and $5.22 as the average support level. This range gives about 12% in sell trade profit without leverage (if we sell at average resistance and buy at average support) and 14.55% in buy trade profit without leverage (if we buy at average support and sell at average resistance). Thus we can rightly say that during this period, price ranges with high volatility.
Q.4. Explain the importance of the Volume indicator. How does volume confirm a trend? Do this for the 3 phases of the market (Screenshots required).
Perhaps, one of the most important indicators in technical analysis is the volume indicator. For one thing, Tradingview permits only 3 indicators at a time for the free trial version but if you still want to see volume after adding 3 indicators, it's allowed.
Volume tells you what exactly is happening in the market. It is as important as price itself. Volume tells you the credibility of a certain price in the mind of traders. When there is high volumes in the market, it shows that traders welcome the idea of trading at the prices involved. When volume is low, it shows that traders are reluctant to deal at the prices involved.
Simply put, volume indicator is very important because it tells the willingness of buyers and sellers to trade at a particular price. The willingness of traders to trade at a particular price (both buyers and sellers) tells if price will proceed in a particular direction.
HOW DOES VOLUME CONFIRM A TREND
UPTREND
When there is an uptrend and prices are going up with high volumes, it means that the uptrend is highly supported by buyers and sellers in the market. Of course, in this case, the sellers are in charge, selling at higher and higher prices as they would love to while the buyers though against their preference are resigned to accepting the high prices and also buying large quantities.
When buyers accept large quantities at high prices, you can be sure they are also planning to sell at higher prices and so we have new sellers who are even envisaging higher prices. And when they finally enter the market, they quote higher and if volumes remains large, market continues upwards.
Consider the LUNA/USDT 4H chart below
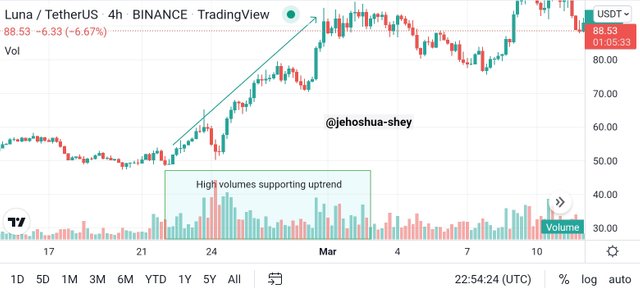
During the uptrend in the chart above, we see increased volumes at the start of the uptrend as price turns upwards. Volumes remained high and price continued upwards.
Twice when price seemed to go down with four consecutive red candles, we saw a trend continuation accompanied by long green volume bars indicating large volumes. These large volumes at higher prices during the pullback facilitated the trend continuation.
DOWNTREND
When there is a downtrend and prices are falling with high volumes, it also means that the downtrend is highly supported by buyers and sellers in the market. Of course, in this case, the buyers are in charge, buying at lower and lower prices as they would love to while the sellers though against their preference are resigned to accepting the low prices and also selling large quantities.
When sellers sell off large quantities at low prices, you can be sure they are also planning to buy back at lower prices and so we have new buyers who are even envisaging lower prices. And when they finally enter the market, they quote lower prices and if volumes remains large, market continues downwards.
Consider the BTC/USD 4H chart below
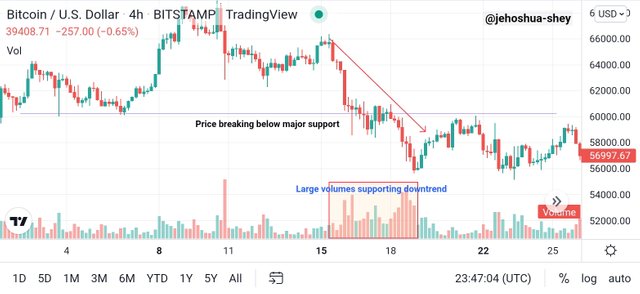
During the dowmtrend in the chart above, we see increased volumes at the start of the downtrend as price turns downwards. Volumes remained high and price continued downwards.
When price seemed to go up with two consecutive green candles, we saw a trend continuation accompanied by long green volume bars indicating large volumes. These large volumes at lower prices during the pullback facilitated the trend continuation.
RANGING MARKET
When the market is trading in a range, especially when there is low volatility, we see that volume tends to be very small compared to when the market is trending. This is simply because both buyers and sellers all want to have their way in the market so there's no total submission from any party.
Prices are not okay for buyers (i.e. to high for their liking), they hardly buy and if prices are not okay for sellers (i.e. to low for them) they hardly sell. Overall, the market goes upwards and down as the struggle for dominance drags on.
Consider the ETHUSDT 30mins chart below
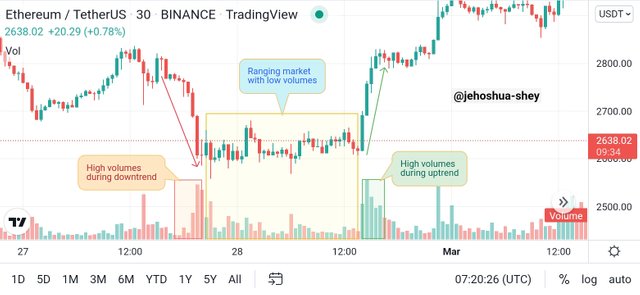
We see a surge in volume as price embarks on a bearish run before ranging. During the ranging period, volume flattens as price is bounces off from supports and resistances. By the time volume picks up, price rice begins a run, this time to the upside.
From the chart, we see that during the range period, volumes are relatively low. High volumes are usually synonymous with trends.
Q.5. Explain the trade criteria for the three phases of the market. (show screenshots)
The trade criteria for the three phases of the market are explained below
UPTREND
During the UPTREND, as it is usually advised not to trade against the trend, we enter a buy trade. Here are the following steps to take:
First confirm the UPTREND with the formation of higher highs and higher lows.
Next confirm that volume is in consonance with rising prices.
Allow a pullback to form a low.
Upon a valid sign of trend continuation using candle patterns or indicators, enter a buy trade.
Set stoploss below the low point formed and set take profit using appropriate risk to reward ratio.
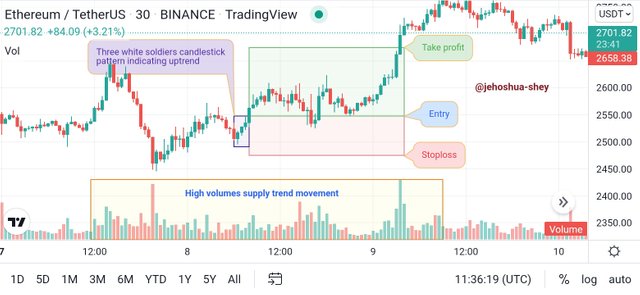
From the chart above, we see an uptrend formed with higher highs and higher lows. We also see volume relatively higher and in consonance with the uptrend. After a pullback forms we enter a buy trade upon sighting a valid candlestick pattern supporting a bullish movement (three white soldiers).
Stoploss was set below low point formed and take profit went as high as 2:1 ratio.
DOWNTREND
During the DOWNTREND, as it is usually advised not to trade against the trend, we enter a sell trade. Here are the following steps to take:
First confirm the DOWNTREND with the formation of lower highs and lower lows.
Next confirm that volume is in consonance with falling prices.
Allow a pullback to form a high.
Upon a valid sign of trend continuation using candle patterns or indicators, enter a sell trade.
Set stoploss above the high point formed and set take profit using appropriate risk to reward ratio.
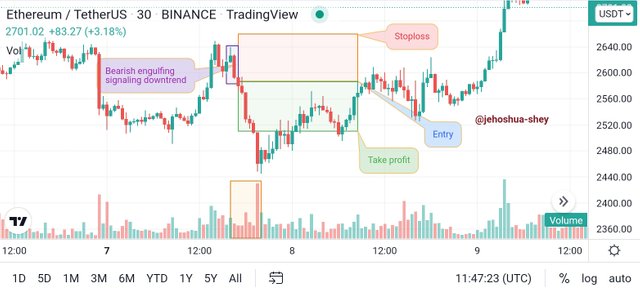
From the chart above, we see a downtrend formed with lower highs and lower lows. We also see volume relatively higher and in consonance with the downtrend. After a pullback forms we enter a buy trade upon sighting a valid candlestick pattern supporting a bearish movement (bearish engulfing).
Stoploss was set above high point formed and take profit was in a 1:1 ratio.
RANGING MARKET
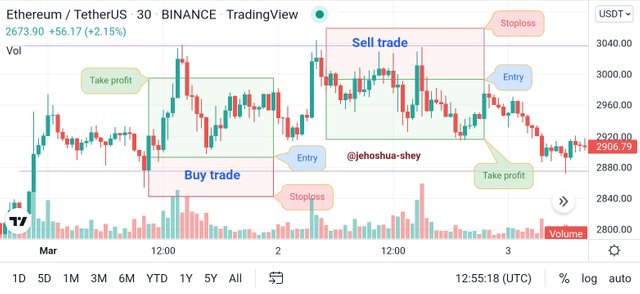
In a ranging market, we can either decide to go long or short. A ranging market provides opportunity for both.
BUY TRADE
For a buy trade, we wait for price to hit the support. Once we get a sign of an upward turn, we enter a buy trade. Our stoploss will be placed below the support formed. Take profit should be placed in a 1:1 ratio with support although we can also take profit at the resistance level .
SELL TRADE
For a sell trade, we wait for price to hit the resistance. Once we get a sign of a downward turn, we enter a sell trade. Our stoploss will be placed above the resistance formed. Take profit should be placed in a 1:1 ratio with resistance although we can also take profit at the resistance level.
Q.6. With the Trade criteria discussed in the previous question, open a demo trade for both Buy/ Sell positions.
So I opened two trade positions with the theory discussed, one a buy position and one a sell position.
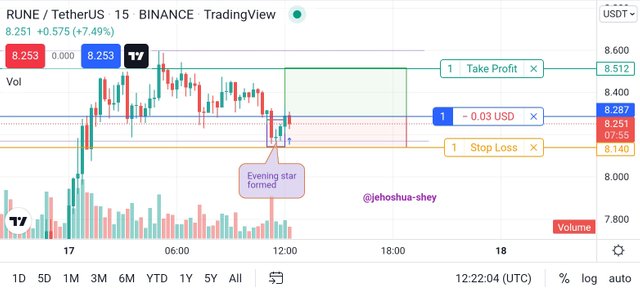
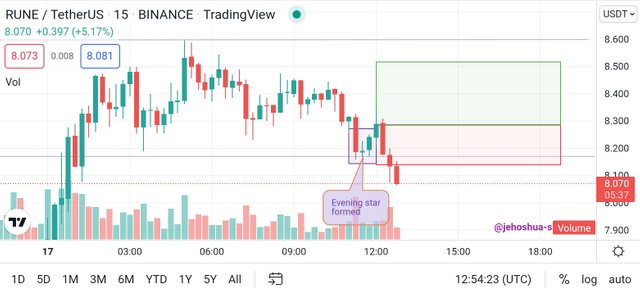
For the buy trade, I traded with the RUNEUSDT pair. I entered this trade upon sighting a ranging market. After price hit support zone, I sighted the formation of the morning star candlestick pattern (I mistakenly referred to it as Evening star in my screenshot).
Unfortunately, it hit stoploss after just few minutes.
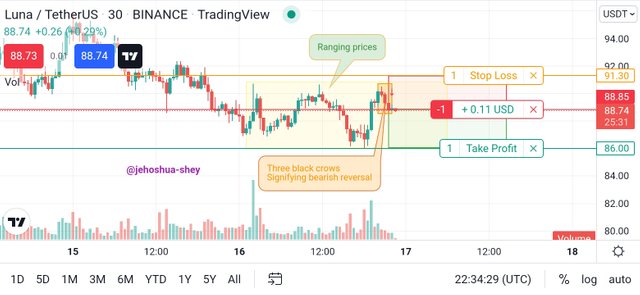
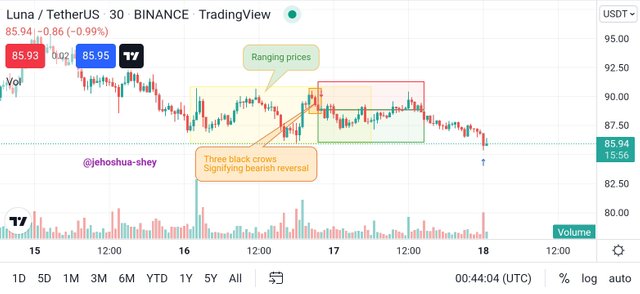
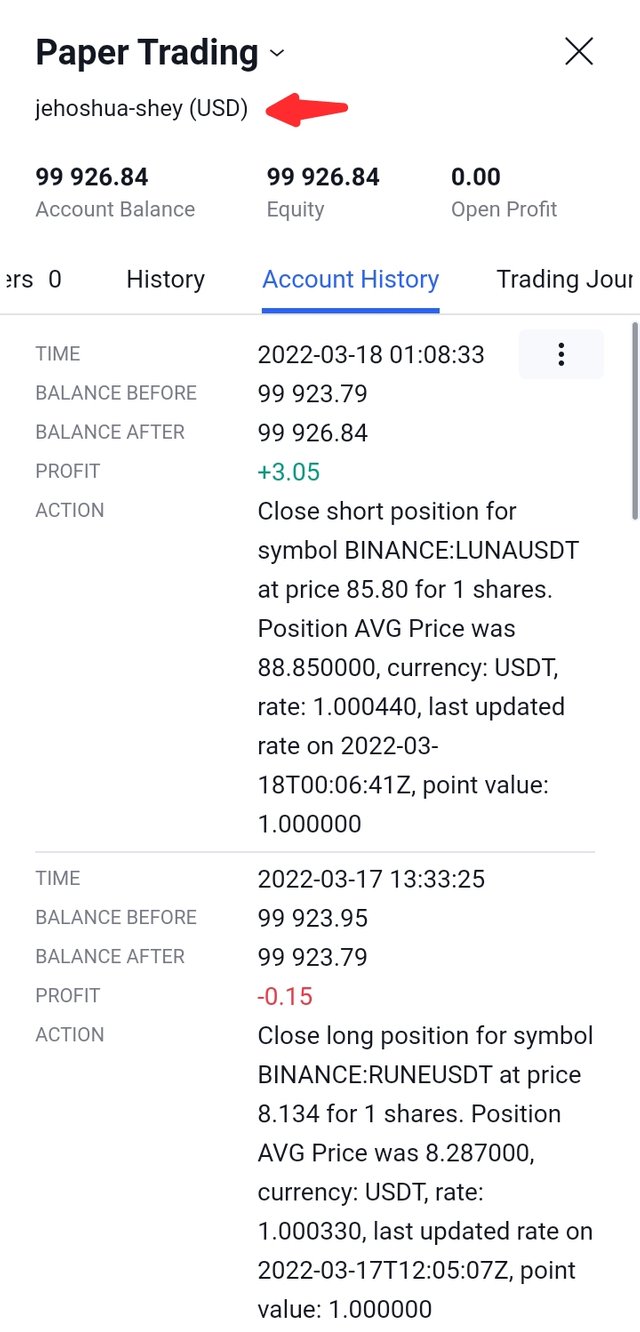
For the sell trade, I shorted LUNAUSDT pair and that lasted for some days before hitting Take profit 😊
For the sell trade, I traded with the RUNEUSDT pair. I entered this trade upon sighting a ranging market. After price hit resistance zone, I sighted the formation of the three black crows candlestick pattern. The trade went below to my take profit.
PROOF OF TRADE
Conclusion
The Dow theory is very important in today's technical analysis. It rightly divided the market I to three phases - uptrend, downtrend, and ranging. With these phases, one can clearly identify any market. With the help of the very important volume indicator, the market phase can be properly identified a d confirmed.
The Dow theory also tells us about phases of a trend which are accumulation and re-accumulation for uptrend and distribution and redistribution for downtrend.
When trading with the Dow theory however, it is import to do confluence trading i.e. trade with a combination of indicators and strategies and also use proper risk management.
Thanks for reading.
Hello @jehoshua-shey , I’m glad you participated in the 4th week Season 6 at the Steemit Crypto Academy. Your grades in this Homework task are as follows:
Observations:
This example isn't in a downtrend.
Recommendation / Feedback:
Thank you for participating in this homework task.