Crypto Academy / Season 4 / Week 1 - Homework Post for @allbert

WEAK AND STRONG LEVELS
If you've heard about candlestick charts, you might have also heard about resistance and support. These are levels from where the price seems to bounce off in the opposite direction.
When the level's up and the price is bouncing back downwards, it's called resistance. When it's down and the price is bouncing back upwards, it's called support.
Sometimes, we find some degree of strength in these levels, sometimes we find out that their just week and not so respected by the price movement.
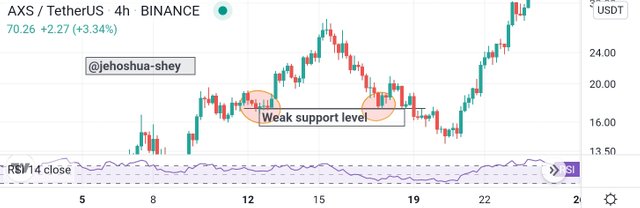
WEAK LEVELS
For weak support or resistance levels, the price recognizes the supports or resistance level at most twice and subsequently breaks it.
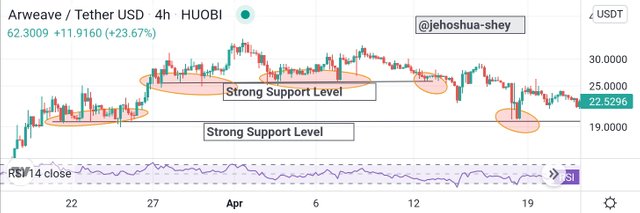
STRONG LEVELS
For strong support or resistance levels, the price recognizes the supports or resistance level more than twice and hardly breaks it.
Differences Between Weak And Strong Levels
In summary, here are the differences between Weak and Strong Levels.
| Weak Levels | Strong Levels |
|---|---|
| Recognized by price movement at most twice | Recognized by price movement more than twice |
| Easily broken | Hardly broken |
Market Actions During Weak and Strong Levels
Market activity during the weak and strong levels are what resulted in the weakness or strength of the level. Here's how market actions affect the strength of a support or resistance level.
Strong Levels
For Strong Levels, these levels are prices at which people have opened orders which would be filled when the market price drops or rises to those prices.
Now, the levels are strong when there are so many orders opened for that price. So when the market price gets there, orders are fulfilled, forcing the market to rebound. Because the orders are much, they won't be exhausted the first or second time the market price reaches the set price. This is why we have market price reaching strong levels more than twice.
Weak Levels
For Weak Levels, these levels are also prices at which people have opened orders which would be filled when the market price drops or rises to those prices.
Now, the levels are weak when there are not so many orders opened for that price. So when the market price gets there, orders are fulfilled, forcing the market to rebound. But because the orders are not so much, they would be exhausted the first or second time the market price reaches the set price. This is why we have market price reaching strong levels not more than twice.
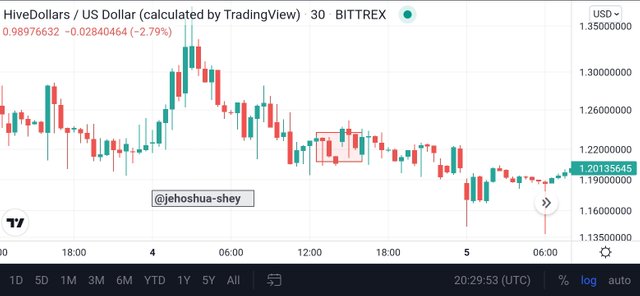
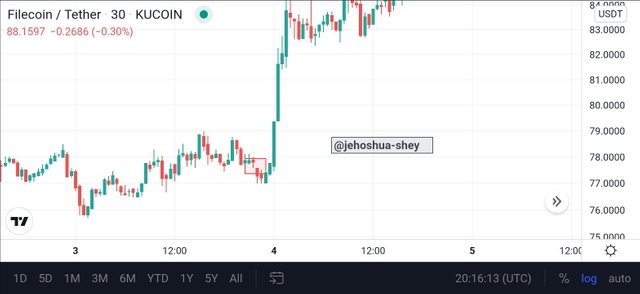
GAP
A gap is that space on a candlestick chart between the opening price of a new candle and the closing price of the previous one.
Technically, it's a void created as a result of price jump from a previous level to a new one, without trading in between.
Gaps are formed when a large volume of an asset suddenly makes an entry (buy/sell) into the market at a price significantly away from the previous price (upwards or downwards). These gaps create very sensitive levels for both support and resistance cases.
TYPES OF GAPS
Breakaway Gap
This type of gap occurs in form of a breakout from an existing trend. It's the beginning of a new trend and forms strong levels (support/resistance).
Runaway Gap
This one occurs close to the beginning of a trend. Unlike the Breakaway Gap, it indicates a continuation of the trend.
Exhaustion Gap
This gap occurs towards the end of the trend. It can be regarded as the last strengths of the trend. Shortly after the exhaustion gap, the trend ends and there is a reversal.
DEMO TRADE USING STRONG LEVELS
Strong Support Levels
For the strong support level below, I used the MSB strategy to trade. I employed this strategy after I identified a strong support level followed by a breakout.
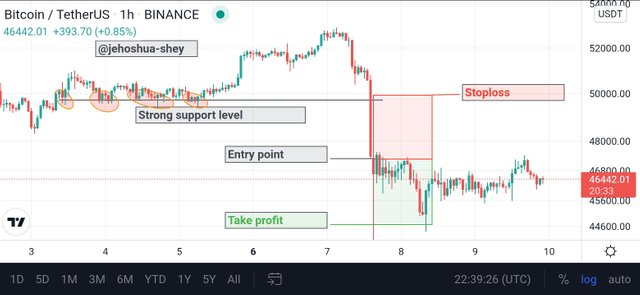
I set my entry point after the end of the long candle. I then set my stoploss above the strong support level that was broken. Lastly, I set my take profit to be in a 1:1 ratio with my stoploss.
From the chart above, the trade hit my take profit, only that it was a demo trade.
Strong Resistance Levels
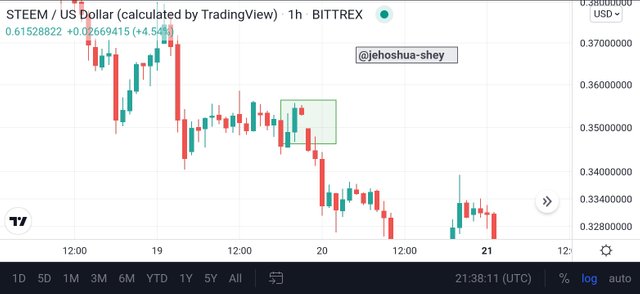
For my strong resistance levels demo trade, I found a breakout from a strong resistance level and also saw that the price retested the strong resistance level before going back up. Hence, I decided to apply the BRB strategy.
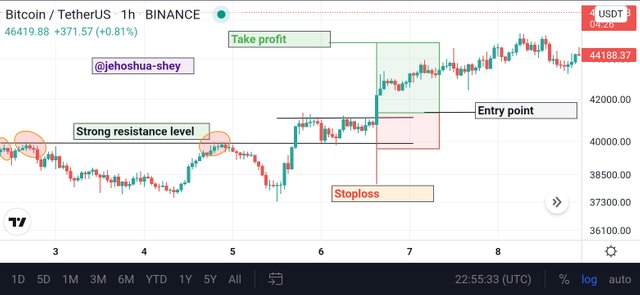
I set my entry point just above the new swing high formed after the price went for a retest. I then set my stoploss below the strong resistance level. My take profit was set at a 2.2:1 ratio to my stoploss, this means that my take profit was 2.2x more than my stoploss.
From the chart above, the trade hit my take profit.
Gaps
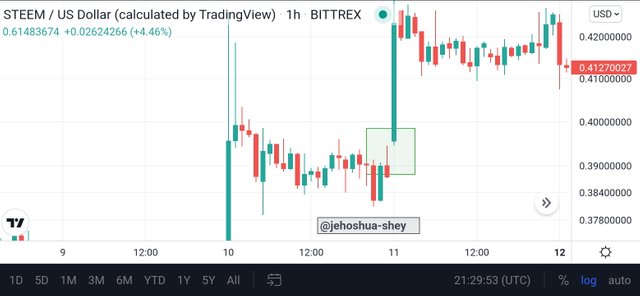
For my gap demo trade, I was able to identify a gap and this was how I traded.
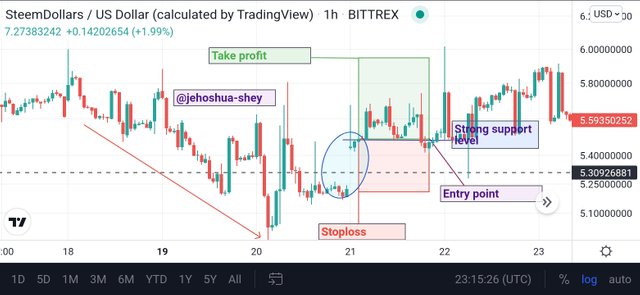
This gap was so significant that not only was it formed at the end of a trend, it formed a strong support level and the gap had a good distance.
I traded with the MSB strategy. I set my entry point at the strong support level created by the gap.
Next, I set my stop loss at the previous price. I did because I reasoned that with the significant gap and the strong support level created well above a down trend, the price will hardly fill the gap.
I set my stoploss at a 2:1 ratio. The trade ended with the price action hitting my take profit.
CONCLUSION
Gaps and strong levels are very important trading concepts that offers the trader very valuable guide. With strong levels, the trader can trade with a high degree of confidence and more often take profits.
Gaps come in different forms, each requiring different trade strategies. These forms of gaps have to be correctly identified and the appropriate trading strategy correctly applied for maximal benefits. Strategies to trade gaps include MSB and BRB.
Both MSB and BRB can also be used to trade strong levels, depending on the situation
In all, when properly understood and applied, these concepts will help the trade secure more profits.
Thanks for reading.
Cc:
@allbert
All images are either created by me using desygner or screenshots of my account on tradingview.