Trading Strategy with Median Indicator - Steemit Crypto Academy |S6W4| - Homework Post for Professor @abdu.navi03 by @iloveakuma


Explain your understanding with the median indicator.
As we are all aware, trading Cryptocurrencies require a lot of practice, tools and strategies. This is due to their extremely volatile nature. However there are tools which traders use to be able to correctly predict such movements. One of such tools is technical indicators. Technical indicators is perhaps the most useful tool for technical analysis, trusted by traders worldwide. Today we'll be looking at the Median Indicator, and how it can be used for the trading of cryptocurrencies.
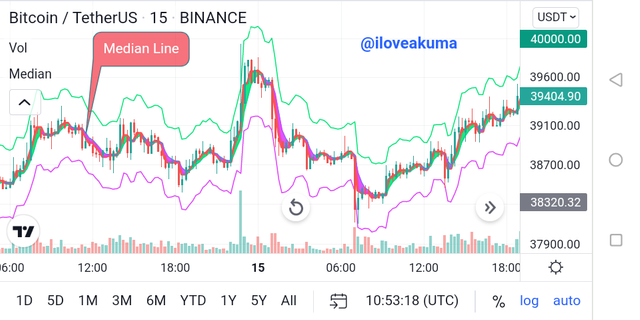
The Median Indicator is an indicator which is used by traders to determine the median value of price, taking into consideration the high and low of price at a particular point in time, represent by the median line. The median line is surrounded by 2 bands, which forms a cloud around the price action. The colour of this cloud and the median line should interest traders because when it turns green It signifies a buy signal (bullish trend), and when it turns purple, it gives a sell signal (bearish trend). As such, traders are advised to go long when it turns green, and go short when the colour changes to purple. This indicator also consists a EMA line. When we're in an uptrend, the median line is above the EMA line, and when we're in a downtrend, the median line trades below the EMA line.
From the above explanation, we can see that the indicator is a trend based indicator, and as such, it is very useful in a trending market, and it is not suitable for a ranging/sideways market. Traders can use this indicator to easily determine current market trend.
Another point worth noting is the fact that as long as price is above the median line, it means the market is bullish, and when price is below the median line, it means the market is bearish, thereby presenting opportunity to either go long or short.
Parameters and Calculations of Median indicator. (Screenshot required)
Before we look at the parameters and calculations involved with this indicator, let us first of all take a look at how we can add this indicator to our chart.
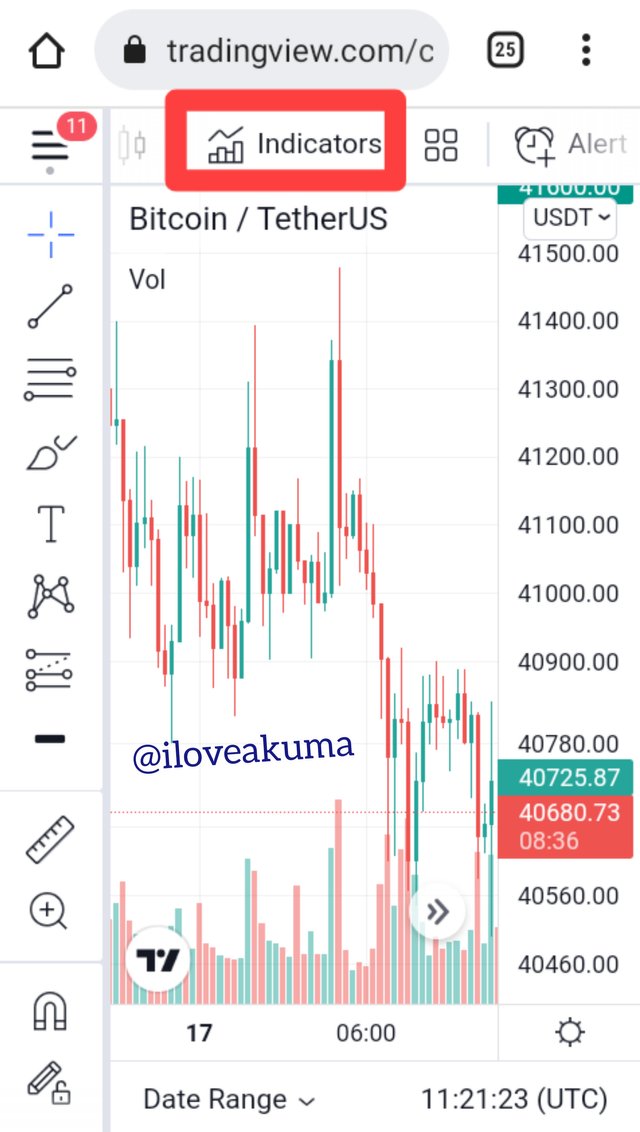
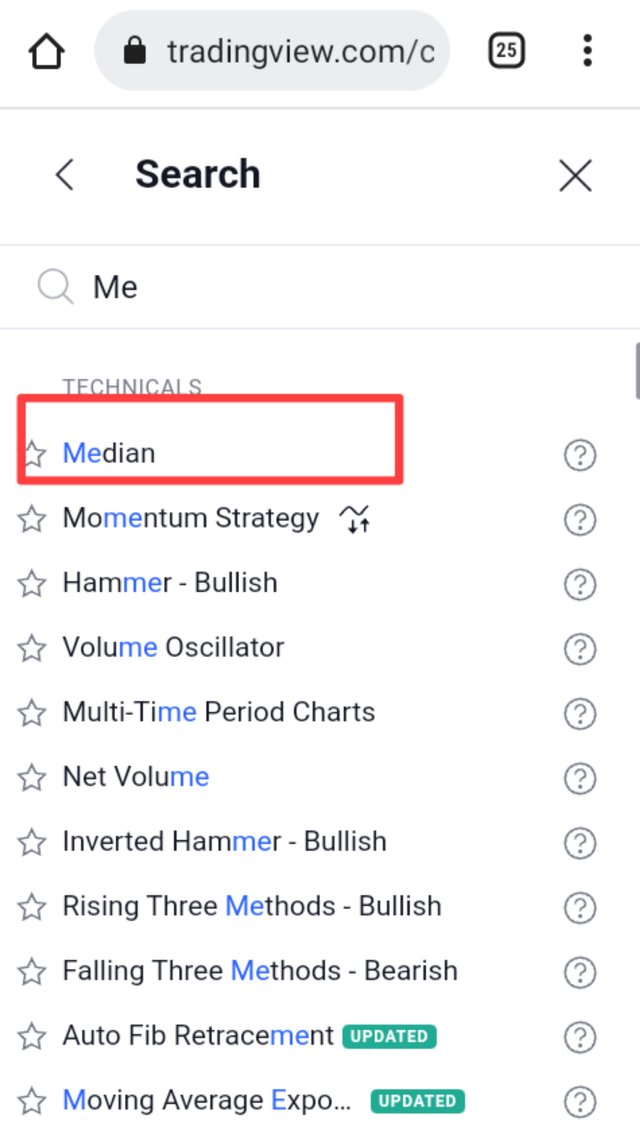
• Firstly, login in to trading view and load up your chart. Once that is done, scroll to the indicators tab and click on it. Proceed to search for Median, using the search bar. Once you find it, click on it so as to insert it on your chart.
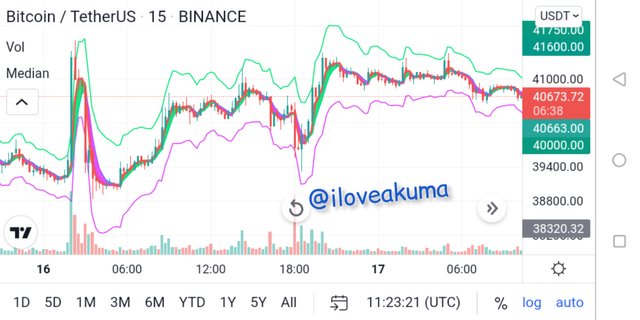
Image Source tradingview
• Now, to configure the parameters of this indicator, we go to the indicator settings.
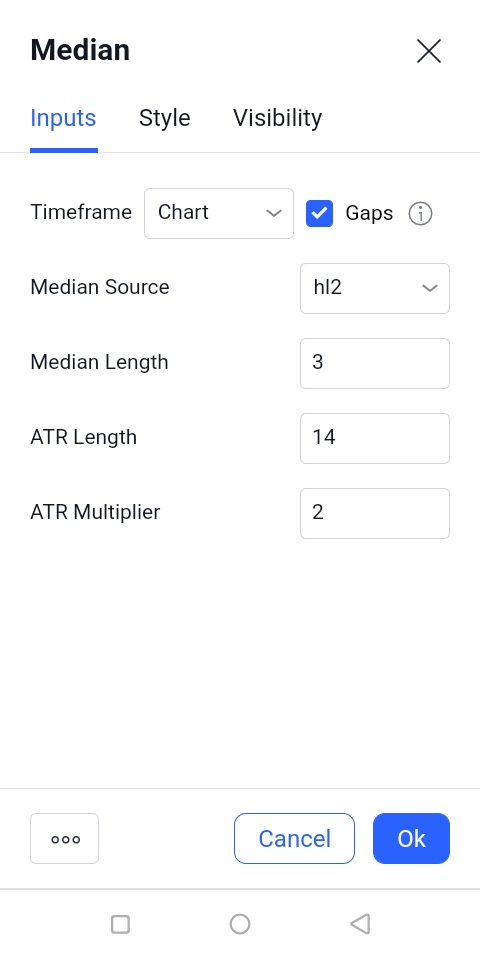
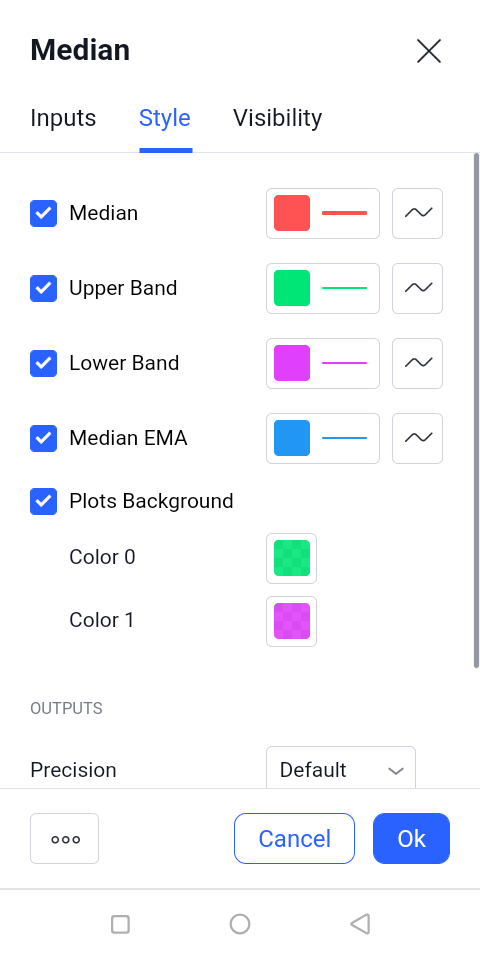
Image source tradingview
As we can see above. These are some parameters which can be adjusted to suit a trader's trading system. Settings such as median length, ATR length and ATR multiplier can all be changed. We can also change the colour of the bands, median line, amongst others.
Technical indicators often involves some complex mathematical calculations where some specific factors are taken into consideration for its calculation. For the Median indicator, the 3 factors taken into consideration include; The Median Length, ATR Length and ATR Multiplier. Any wrong configuration of these 3 indicators, can lead to the generation of false signals. As I also mentioned above, the price action is usually surrounded by 2 bands. Let's take a look and the mathematical formula used for calculating this indicator;
Average Price= Highest price + Lowest price /2
Median = ( Average price + ATR) / ATR
Upper Band = Median + 2 ATR
Lower Band = Median - 2 ATR
However there's no need you to bother yourself about the calculations, since the indicator already does that by itself. It'll also be preferable to use this indicator in its default settings, especially as wrong configuration can lead to inaccurate and false signals, thereby leading to losses.
Uptrend from Median indicator (screenshot required)
As I earlier mentioned, the median indicator is a trend based indicator, which means it can be easily used to spot uptrends and downtrends. In the case of uptrends, we monitor the median line. Once the median line turns green, it signifies a bullish move, and traders can expect prices to rise. Therefore they're advised to buy. As long as the median line is above the EMA, the bullish move will continue. But once it breaks below, it signifies the end of the uptrend as the line will turn purple, and prices will fall.
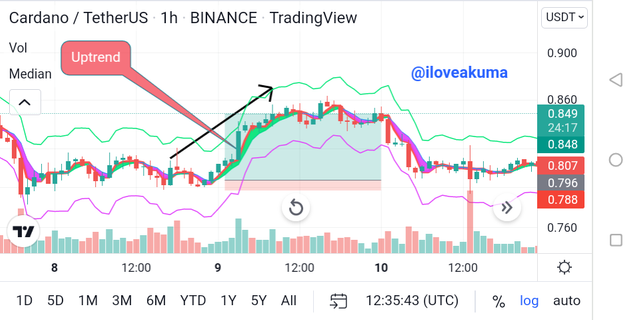
Image source tradingview
As can be seen from the ADA/USDT chart above, price was initially in a downtrend, then it began ranging for a while, then the median line eventually turned green which was our bullish signal. From there, we can see that price continues in an uptrend, and price was above the EMA line. The median line also went above the EMA line.
Downtrend from Median Indicator (screenshot required)
In the case of downtrends, we monitor the median line. Once the median line turns purple, it signifies a bearish move, and traders can expect prices to fall. Therefore they're advised to go short. As long as price and the median line are below the EMA, the bearish move will continue. But once the Median line breaks above the EMA line, it signifies the end of the downtrend as the line will turn green, and prices will rise.
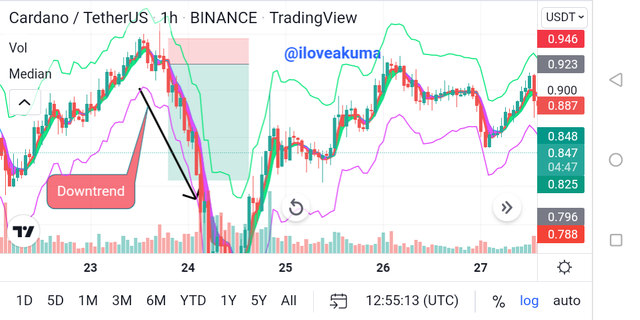
Image source tradingview
As can be seen from the ADA/USDT chart above, price was initturned green which was our bullish signal. From there, we can see that price continues in an uptrend, and price was above the EMA line. The median line also went above the EMA line.
Identifying fake Signals with Median indicator(screenshot required)
While technical indicators give traders an advantage when trading, just like any other system, they can never be 100% accurate. Often, these indicators have the reputation of generating false signals. So, every trader needs to learn how to identify these false signals.
To identify this false signal, I will be using the median indicator accompanied by the RSI. RSI is a volatility based indicator. It works by identifying overbought and oversold zones. Once the indicator oscillates above 70, it is in its overbought zone, and traders are to sell. When the indicator oscillates below 30, it is in its oversold zone and traders are to buy.
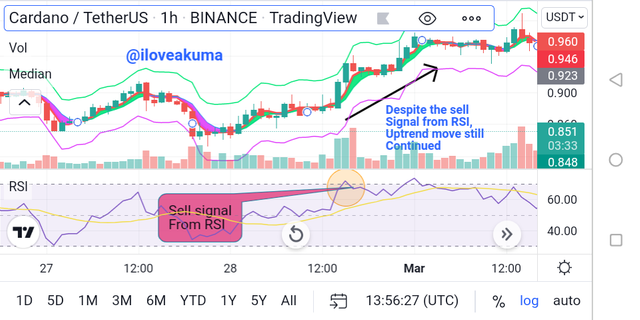
Image source tradingview
As can be seen on the chart above, the RSI indicator went above 70, indicating that ADA/USDT was at that point overbought and traders should look forward to going short at the asset. But looking at the median indicator, and the chart as a whole, no reversal happened. Infact, the uptrend move continued. Meaning the signal given by the RSI was false.
By combining indicators, traders can be able to detect false signals better, thereby leading to more profitable trading.
Open two demo trades, long and short, with the help of a median indicator or combination that includes a median indicator (screenshot required)
I will be taking 2 orders on my demo account, using the knowledge I have learnt about the median indicator.
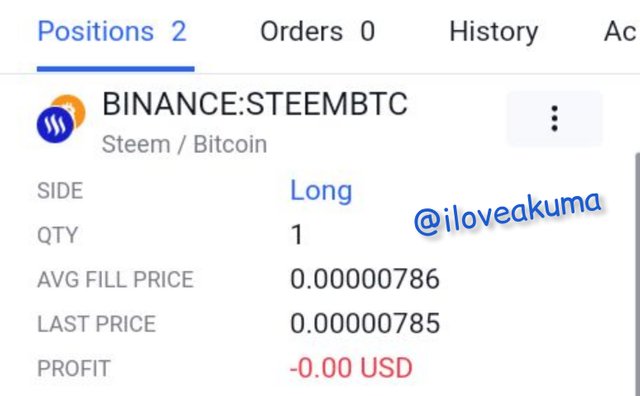
Long Trade
As can be seen on the STEEM/BTC chart above, the median line is green, and the market is already currently in an uptrend, so I took a long entry, setting my take profit just slightly above the upper band, and I used a risk to reward ratio of 1:1 to set my stop loss.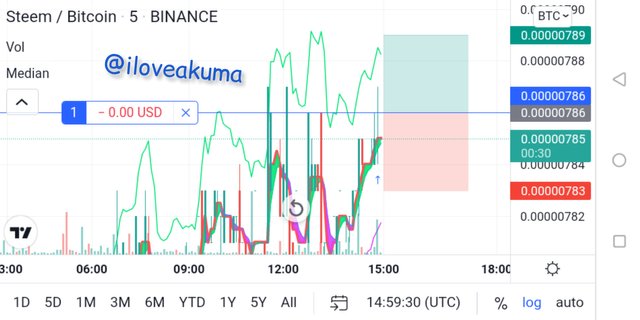
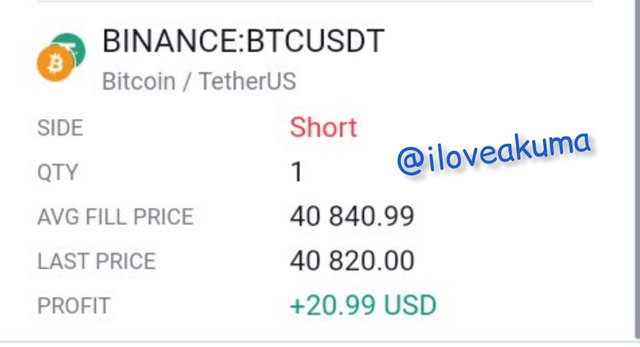
Short Trade
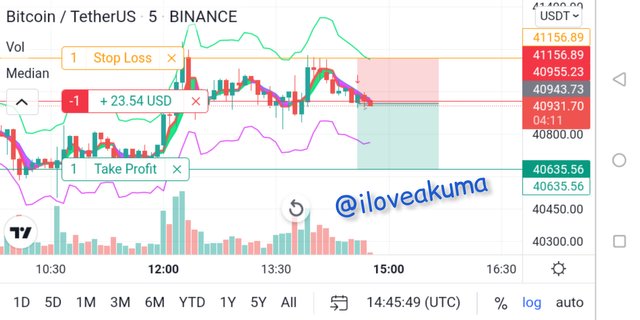
As can be seen in the BTCUSDT chart above, the median line was formerly green, and just turned purple. Price is also trading below the EMA line, and the median line has just crossed the median line downwards. This is a sell signal. I went short, setting my stop loss at the upper band, and my take profit at the next support level.
CONCLUSION
As we have seen above in today's homework post, the median indicator is a very useful tool for technical analysis. It is useful for generating signals, determining market trends and even spotting trend reversals. We've also seen how to be able to detect false signals using this powerful indicator.
The indicator is also very simple to understand and use. I believe if we are able to follow all the instructions in the lecture, then we can use this indicator to trade more profitably and for better market Analysis. I thank the Prof so much for this lecture. I look forward to learning from him again soon.