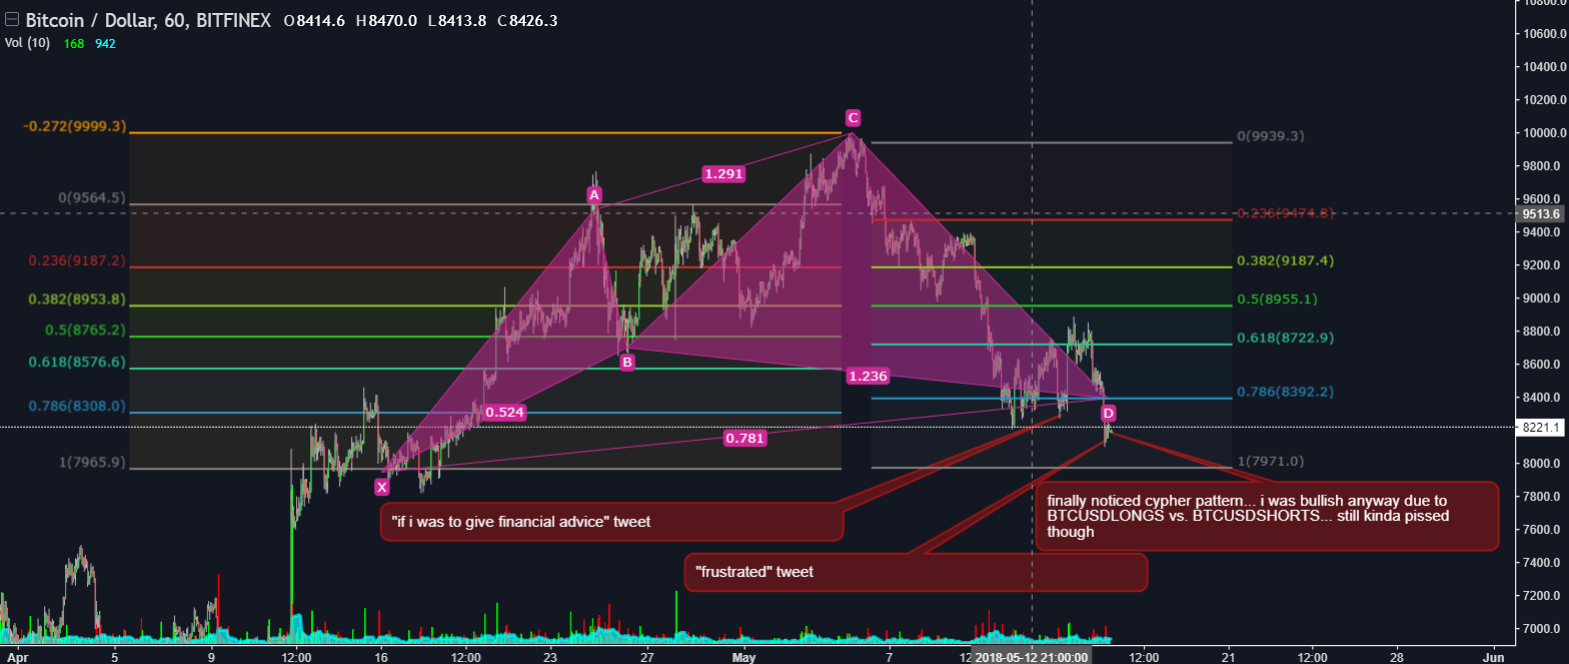
Cypher pattern in bitcoin chart, BTCUSDLONGS much healthier than BTCUSDSHORTS

I've been bullish since we bottomed out around 6.5k anyway, especially referencing my charts of BTCUSDLONGS and BTCUSDSHORTS, showing me it's probably healthier than it might seem. I use my somewhat complex(and currently very messy) analysis of those charts as very complex indicators of the BTCUSD chart. I have posted screenshots on twitter, here's one, for example. They are currently too messy to post publicly on tradingview though.
Update: A more recent comparison.
The targets for trading this cypher pattern would be approximately $8825 and $9250, the .382 and .618 of C to D. I expect it to pretty much blow right through $8825 as shorts get squeezed and a longer-term bullish trend is somewhat easily confirmed by most smart traders.
Update: After hitting the low of $8000, the adjusted targets are $8750 and $9200.
Another, almost immediate, MISERABLE UPDATE: after hitting another LOWER LOW of $7950, the adjusted targets would be $8725 and $9185. The cyper pattern is on the verge of getting invalidated at this point. I'll start to worry about the medium-term health of bitcoin IF we fall below $7925.
See how it unfolds here.
This is not financial advice... Do your own research, trade at your own risk, blah blah blah
-Tom
currently sitting right on the .786 of the X->A retracement after busting through, then finding resistance at the .786 of D->C
BTCUSDSHORTS still looks likely to crash, while the opposite is true for BTCUSDLONGS.
The "cypher pattern" failed more than 24 hours ago when the price went below point x...
It's been a rough few days but BTCUSDLONGS vs BTCUSDSHORTS and all my other charts give me hope that we have finally reached the bottom of this correction @ $7,300 or so. Once BTCUSDSHORTS breaks below ~18,000, I'm expecting it to get pretty exciting, finally :)
-Tom
New harmonic pattern found a few hours ago... the bullish version of the "bat" pattern.
Tradingview chart.
-Tom