Crypto Academy / S4W2 - [Homework Post for professor @kouba01] Crypto Trading With Volume Indicator
Hey there everyone. We are in the week 2 of season 4 Cryptoacademy. This week we learned about Crypto Trading with volume Indicator from professor @kouba01
This will be my assignment post.
Q1. Explain the volume indicator in your own words.
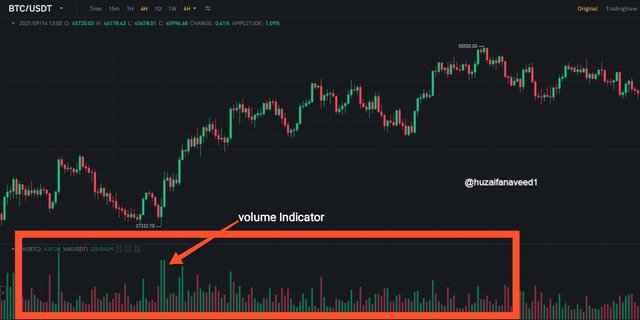
Volume Indicator
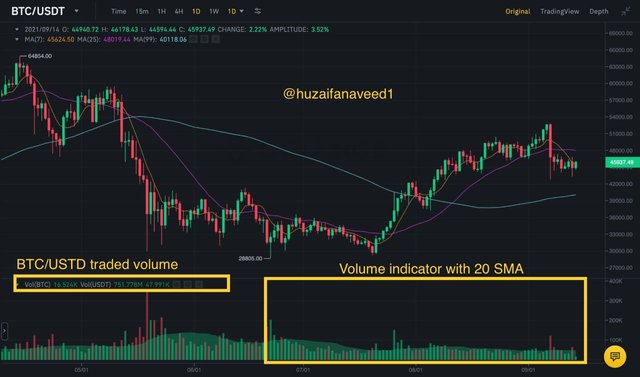
Volume Indicator lies in the category of Technical Indicators which denote us the amount of the asset being traded in the market in a particular time period, generally in USD, EUR etc. The Volume Indicator gives us important information regardung the Liquidity prrsent in the market, and the market activity.
The volume of the asset can be seen as longitudinal bars at the bottom the chart. Each bar symbolises the trades volume in the time frame chosen. For example on 2 hour chart, a volume bar represents the total trade volume for these 2 hours. Similarly in 30 minutes timeframe, a volume bar represents the total trade volume of the 30 minutes
The asset's trades volume is indicated by the size of the volume bar. If there is high trading in the market, the volume bar would be long and if there is low trading in the market, the volume bar would be small. There are two colors of the volume bars, which signify the volume of the asset's price. They are green and red. The green colored bar shows a higher trading volume than the last candle and the red color bar represents a lower trading volume than the last candle.
Binance.com

Q2. Use a platform other than Tradingview to present the volume indicator on a chart and show how to configure its parameters by justifying your choices. (Screenshot required)
Volume Indicator in a chart.
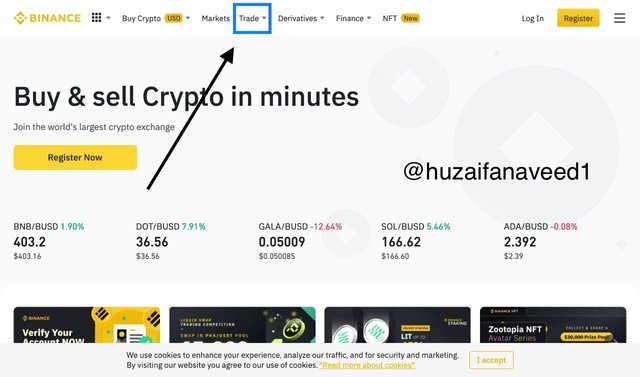
For this question I'll be using the Binance platform.
- First of visit the binance.com platform, log in and then click on the Trade option as demonstrated below
Binance.com
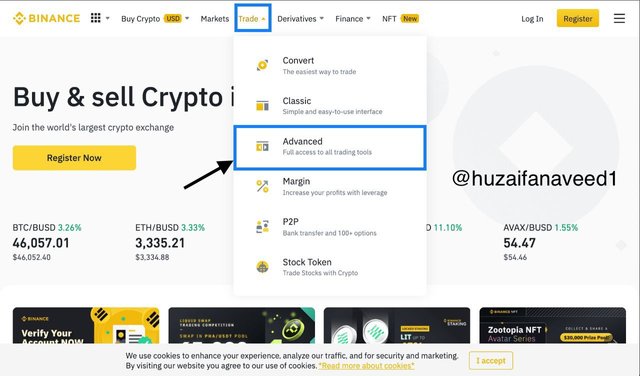
- After clicking on Trade go to the Advanced option
Binance.com
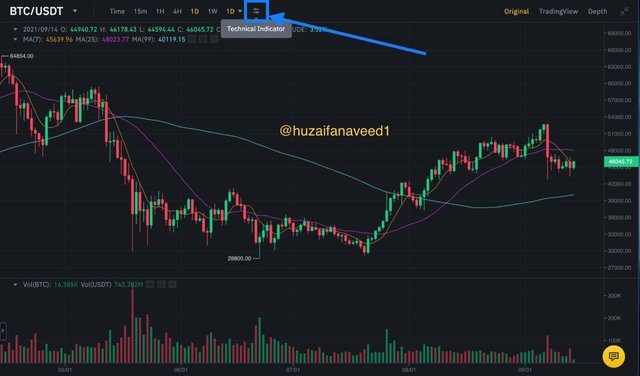
- you will see a chart in front of you. Click on the expand option and then in indicators option
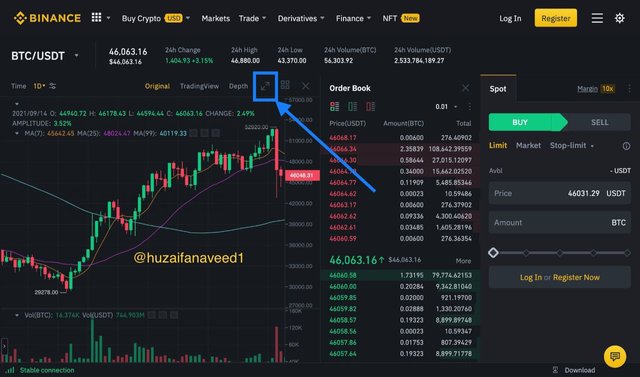
Binance.com
Binance.com
- In the indicators section, click on VOL in the Sub section.
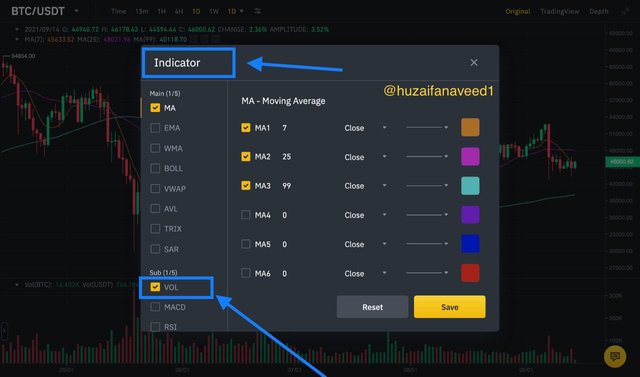
Binance.com
- you can do configuration according to your choice by setting the period. I set the period to 20
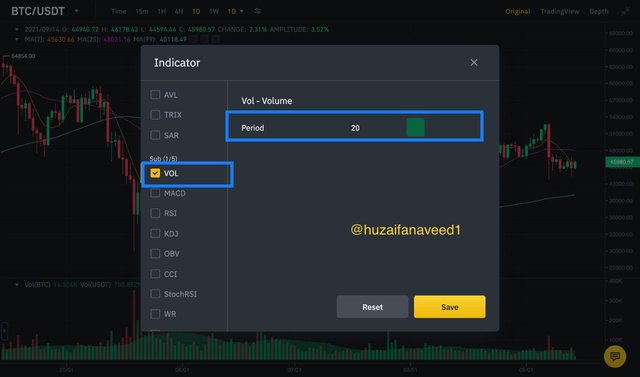
Binance.com
- The volume Indicator will be added to the chart after you confirm your configuration settings.
Binance.com
By setting this SMA period to 20, I would be getting the last closing prices of the past 20 periods. I chose this as it would clear out the markst choice and I feel comfortable with it.
Honestly its the market which actually bring out the best of the SMA. For a day trader like me, I feel comfortable in 20 period as it is not too less like a 8 period SMA and not too much like a 50 period SMA. The 20 period lets me have a good analysis of the ongoing trend in the market.
But you may choose whichever you feel comfortable with.
Q.3 What is the link between Volume and Trend and How to use volume to predict a trend reversal? (Screenshot required)
Relation of Volume and Trend
Through the volume Indicator we can get the potency of the trading pressure in the market. If there is substantial volume then it basically means a greater pressure in the direction of that particular trend.
By analysing the price direction, movement and the volume, the traders can have a good position in the market. Through this we can be cautious of fickle price movements.
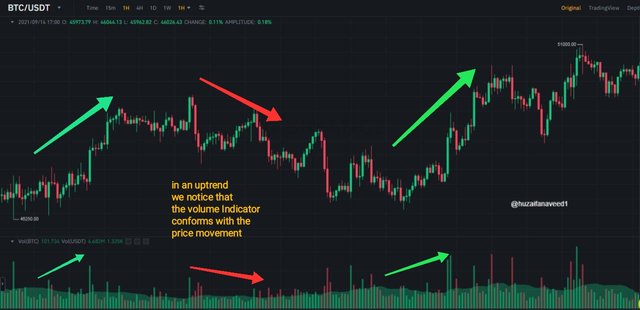
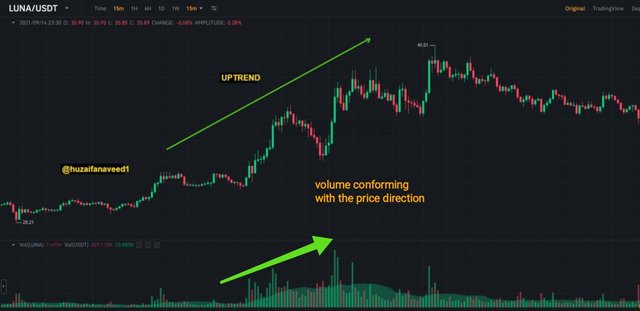
- if we take an uptrend movement into consideration, when the price is bullish, the volume increases, and when the price is going downwards, the volume would decrease as well
Binance.com
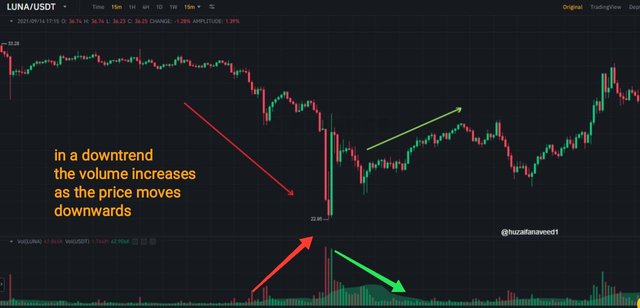
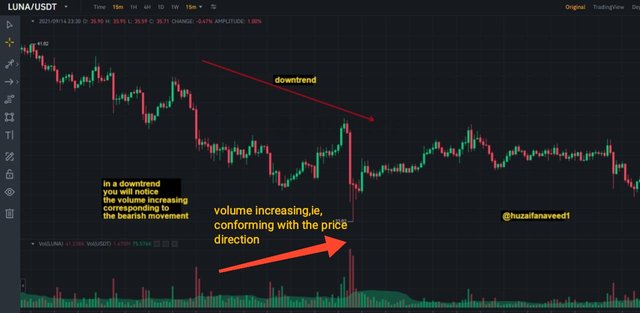
- vice versa in a downward trend, if the price is bearish, the volume would increase and if the price is increasing, the volume would decrease
Binance.com
Predicting a Trend Reversal
The volume Indicator comes in handy for detecting early trend Reversals in the market as well.
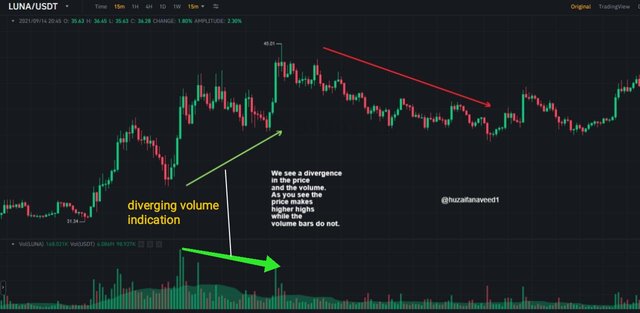
We notice that the Volume Indicator forgoes the market price. If we see that the price of the market is moving upwards, but the volume Indicator is not conforming with the price pattern, this means that there is less buying pressure and it creates a Divergence
Binance.com
In this LUNA/USDT chart above we see a Divergence in the price and the volume. The price is moving in the upwards direction, while the volume is not. This shows that low buyers' pressure and indicates a potential trend reversal.
Q.4 How to use the volume to have a signal confirmation? (Screenshot required)
Volume Indicator Confirmation Signals
Lets discuss the signal confirmation through volume.
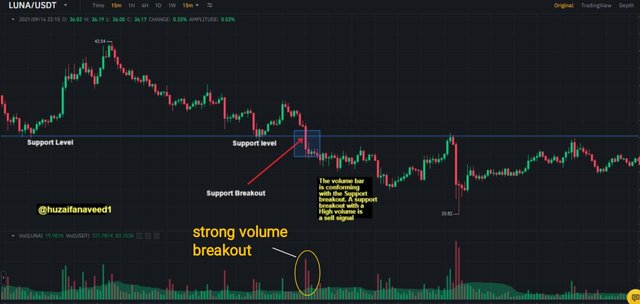
I will demonstrate the signal confirmation through the price breaking the support and resistance levels.
- Support Level
When the price breaks the support level and the volume bars are weak, it would mean the price would probably go back up. But, if the volume is high in a support level breakiut, then it means a strong movement of the price in the downward direction.
Binance.com
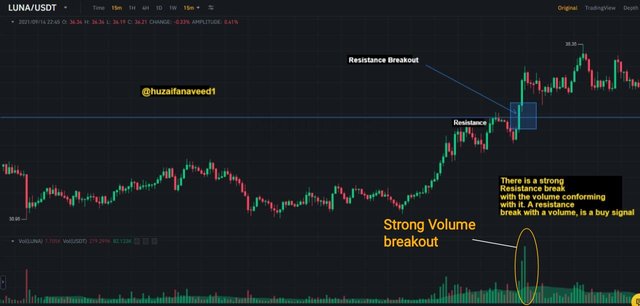
- Resistance Level
Similarly if the volumes are weak in a resistance level breakout, then there are good chances that the price will come down but if the the volume bars are strong then it is a valid steon breakout of the resistance level and it confirms the signal
Binance.com
Q.5 How does the volume reflect the evolution of prices in the charts and why does the volume sometimes anticipate the price? (Screenshot required)
The volume reflects the direction of the trend by conforming with the direction of the price movement. Lets discuss how does the volume reflect the prices in both uptrend and downtrend.
- Uptrend
In the upward direction movement of the price, the volume moves in the upward direction as well. This means that there is an higher buyers' pressure which keeps the upward movement intact. But as the price faces a correction, the volume decreases as well
- Downtrend
In a downtrend , we notice the volume conforming with the price's downwards movement. We have a higher sell pressure which means that the sellers are making the price to fall further.
Binance.com
Volume Anticipating Price
Volume anticipates the price movement which means that the volume will give us an idea of the market reversal before it actually takes place. It does, by denoting the weak buying and selling pressures
When you see the price moving in the upward direction and the volume indicator gets weak even though the price is moving upwards, the decline in the volume Anticipates the coming trend reversal of the price. The same happens in the downtrend. The volume indicator will show a weak volume even though the price is still falling. The volume anticipates a nearing trend reversal.
Q6. Is it better to use the volume indicator alone or use it in parallel with another indicator when trading? Justify your answer
Although it was mentioned by the professor in his lecture as well, but I wouldn't have jumped in the market with only the volume Indicator. It is better to use them with technical indicators like RSI, MACD or moving averages. But since I have a better hold at the MACD, I'd go with that
I never really completely rely on a single indicator while trading. It is always better to use more than one Indicator to have a better hold in the market.
MACD is one of the indicators which I personally use in my trading as well alongside the RSI, to have better trading analysis and decisions.
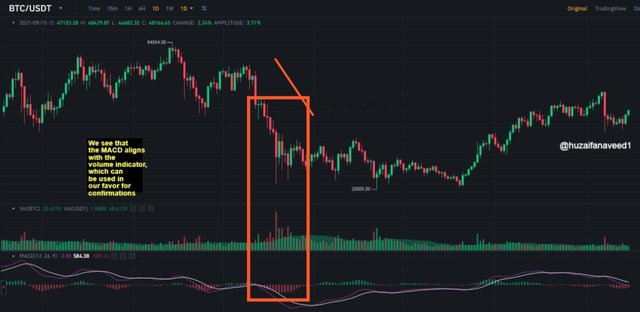
Binance.com
In this demonstration above of BTC/USDT we notice the MACD Indicator aligning with the Volume, so in my opinion it is always better to go in the market witth the indicators you are used to with.
- To understand why would I use other indicators with the volume indicator would be that the volume indicator denotes only the volume of the asset in a particular time period, which means that other factors sometimes lack in it.
- A very good and a very relatable issue would be the ICO. It does not affect the price direction or the movement significantly but the trading volume is changed by it. To overcome the issue other indicators (which ever indicator you're comfortable in using) could be used to have a better position and to avoid fake signals.
Q.7 The volume indicators are multiple, choose one of them to briefly explain its usefulness in crypto trading.
The Volume Money Flow Index
Money Flow Index (MFI) is somewhat similar to the RSI. The MFI is used to evaluate the trading (buying and selling) pressure in the market.
Using the MFI in Crypto Trading
The Money Flow Index line ranges from the 0 to 100 point. If the the MFI increases, it means the buyers' pressure is increased. If the MFI tumbles down, in denotes an increasing sellers' pressure.
Similarly, as I mentioned the level ranges from 0-100. If the MFI is above the 80 level it basically shows that the buying pressure is much more than the selling pressure in the market. Conversely when the MFI value is below the 20 point it is considered as a downward direction, and the sellers'pressure is more than the buying pressure.
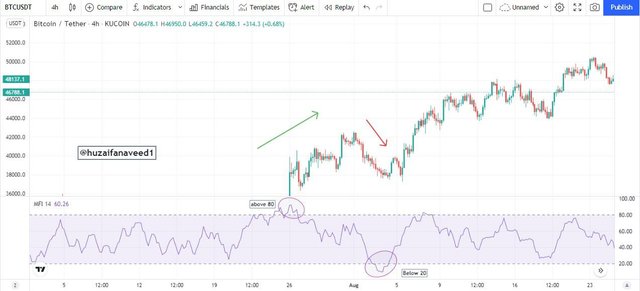
Tradingview.vom
In the demonstration above of BTC/USDT shows the working of the MFI in determining the market pressure and how it indicates us signals.
Volume Indicator, which has my types, comes in handy when a trader wants to determine the buying and selling pressure in the market. It is a good instrument to use in a particular time period and can be used to determing the trend reversals as well. Confirmation of signals can be done through the volume indicator as well through analysing the Support and Resistance levels.
To have a better grip in the market, you should have complete knowledge of the volume indicator.
This was an interesting lecture professor @kouba01 I had a good time making this assignment hope you had a good read as well.
Thank you.
Ps: all screenshots are taken from my binance and tradingview account.
Regards,
@huzaifanaveed1

Hi @huzaifanaveed1
Thanks for participating in the Steemit Crypto Academy
Feedback
This is good content though you made quite a number of typing errors right from the beginning of your article. You need to always proofread your work to rectify such errors before submitting your work for review. Otherwise thanks for your effort put in demonstrating your understanding of trading with the volume indicator.
Total| 7/10