Crypto Academy / Season 3 / Week 8 / Homework Post For Professor @cryptokraze: Trading Sharkfin Pattern


Question 1
What is your understanding of Sharkfin Patterns. Give Examples (Clear Charts Needed)
When trading the financial markets, sometimes we notice that the market is moving in a particular direction in a very fast pace. Most people follow this trend and sometimes make some profit from it. But in some other occasions, you'll notice a very sharp reversal. When you look at the shape formed by this reversal, you'll see that it's in form of a V shape.
Now, if the market is trending downwards fast, then suddenly there's a sharp reversal to the upside, this is the V shape pattern. But if on the other hand, the market is trending upwards fast, and then there's a quick reversal to the downside, this is called the Inverted V Shape Pattern. When you see this pattern, it is called the Sharkfin Pattern.
The main use of this sharkfin pattern, is to help you know when there's a good reversal, and identify it early enough, so that you can take advantage of it and make good profit for yourself.
Examples
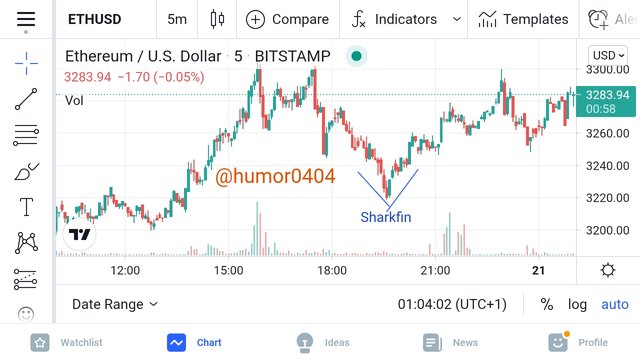
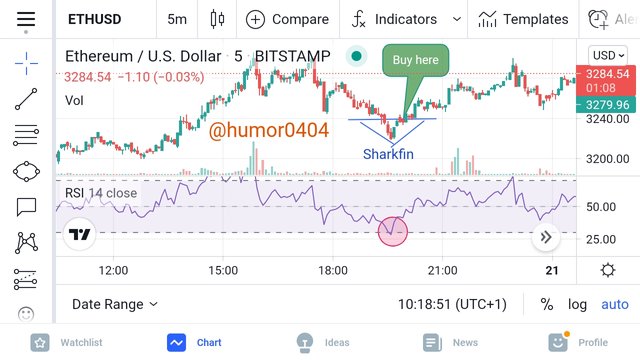
Here is an example of the V shape pattern on the 5min chart ETH/USDT. The market was in a downtrend, then there was a very quick reversal to the upside, and that made the V shape pattern.
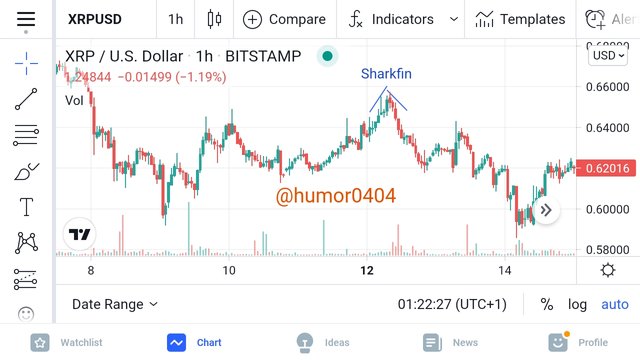
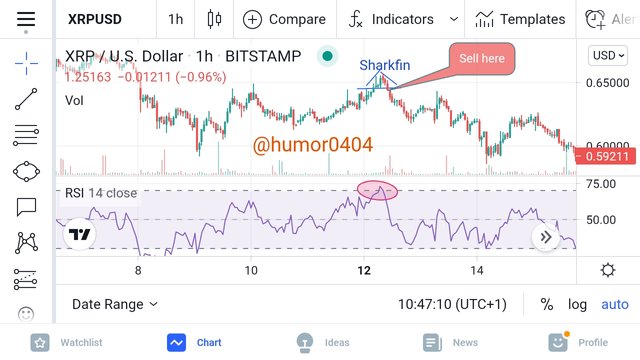
For the Inverted V shape pattern, here's an example of it on the 1h chart of XRP/USDT. The market was in an uptrend as you can see from the image below, then there was a quick reversal downwards, and that formed the Inverted V shape pattern.
Question 2
Implement RSI indicator to spot sharkfin patterns. (Clear Charts Needed)
As you can see from the examples above, it's not very difficult to understand the idea of the sharkfin pattern. But it will be nice to add an indicator that will help you confirm when the sharkfin pattern is happening, so that you don't get in wrong.
For this, our respected Professor has recommended the use of the RSI indicator in order to identify the sharkfin pattern. When you add the RSI to your chart, you should make sure that it's on default settings. You should ensure that the bands are both at 30 and at 70, also you should set the length at 14.
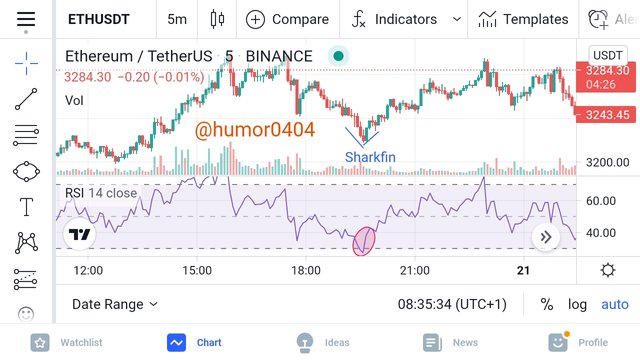
What you're looking for in order to say that a sharkfin pattern is good is - in cases where the price is going down, you're looking for a reversal to the upside, the RSI indicator should show that price has gone below 30 level, afterwards makes a sharp reversal upwards by moving above the 30 level. Then you'll see the V shape pattern, this confirms the sharkfin pattern.
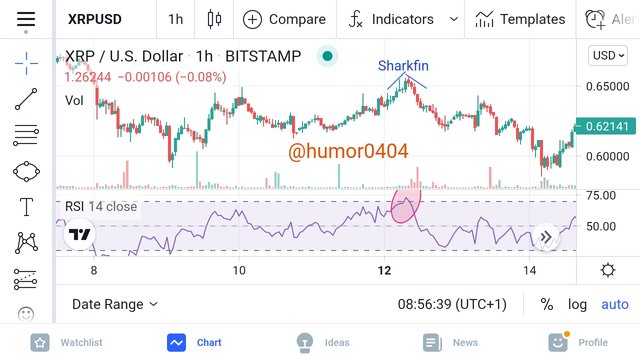
And likewise, for when the price is going up, you're looking for a reversal to the downside, the RSI indicator should show the price has gone above the 70 level and makes a sharp reversal downwards by moving below the 70 level. Then, you should see an Inverted V shape
pattern. This confirms the sharkfin pattern
Question 3
Write the trade entry and exit criteria to trade sharkfin pattern (Clear Charts Needed)
When trading, you can either enter buy positions or sell positions. Hence, I'll be showing the criteria for trading both buy and sell positions. Another thing that should be understood is that, if you're trading on crypto exchanges, you can only trade the buy positions, you can't sell. But if you want to sell then you can do so on margin trading, or on platforms that support sell trades for example metatrader.
Entry Criteria for Buy Position
- You should add the RSI indicator to your chart. And it should be on default settings
- You should wait for price to make a sharp move down, and then make a quick reversal, forming the V shape.
- You should confirm using the RSI indicator that price has gone below level 30, and made a quick reversal above level 30, forming the V shape pattern.
- After confirming that RSI is clearly above level 30, you can place your buy order.
Entry Criteria for Sell Position
- You should add the RSI indicator to your chart. And it should be on default settings
- You should wait for price to make a sharp move up, and then make a quick reversal, forming the inverted V shape
- You should confirm using the RSI indicator that price has gone above level 70, and made a quick reversal below level 70, forming the inverted V shape pattern.
- After confirming that RSI is clearly below level 70, you can place your sell order.
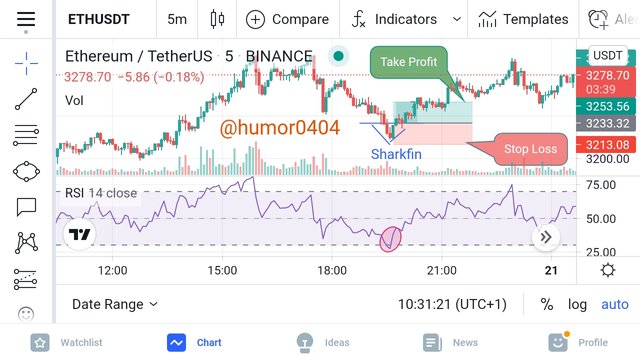
Exit Criteria for Buy Position
- You should ensure to set a Stop Loss level, to cut your loss if the trade doesn't go in your favor.
- You should place your Stop Loss level below the swing low point of your sharkfin.
- Should the price by any chance cross your stop loss level, it indicates that your trade setup didn't work in your favor, and you should stop the trade, and then wait for another trade setup.
- You should make sure you set Take Profit level, should the trade go in your favor.
- You should set your Take Profit level at 1:1 Risk:Reward, hence your Take Profit level and Stop Loss level are equal.
- You should book your profits and get out of the trade, when price reaches your Take Profit level.
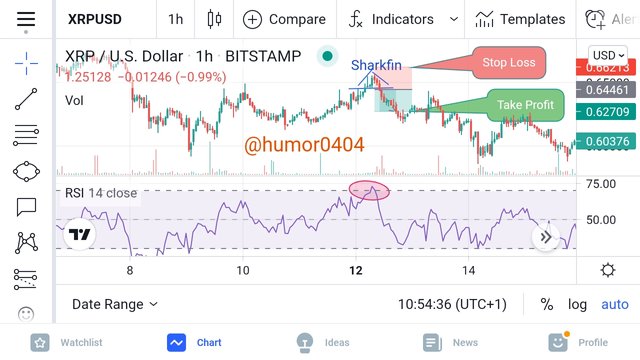
Exit Criteria for Sell Position
- You should ensure to set a Stop Loss level, to cut your loss if the trade doesn't go in your favor.
- You should place your Stop Loss level above the swing high point of your sharkfin.
- Should the price by any chance cross your stop loss level, it indicates that your trade setup didn't work in your favor, and you should stop the trade, and then wait for another trade setup.
- You should make sure you set Take Profit level, should the trade go in your favor.
- You should set your Take Profit level at 1:1 Risk:Reward, hence your Take Profit level and Stop Loss level are equal.
- You should book your profits and get out of the trade, when price reaches your Take Profit level.
Question 4
Place at least 2 trades based on sharkfin pattern strategy (Need to actually place trades in demo account along with Clear Charts)
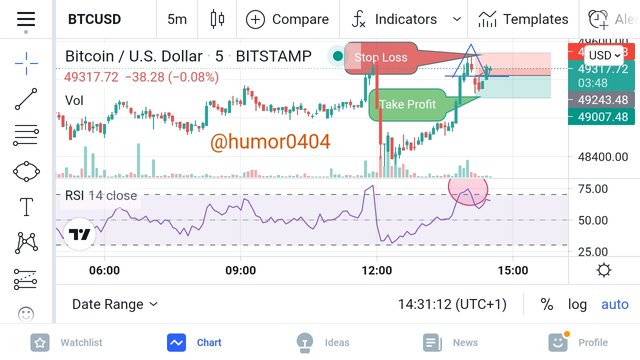
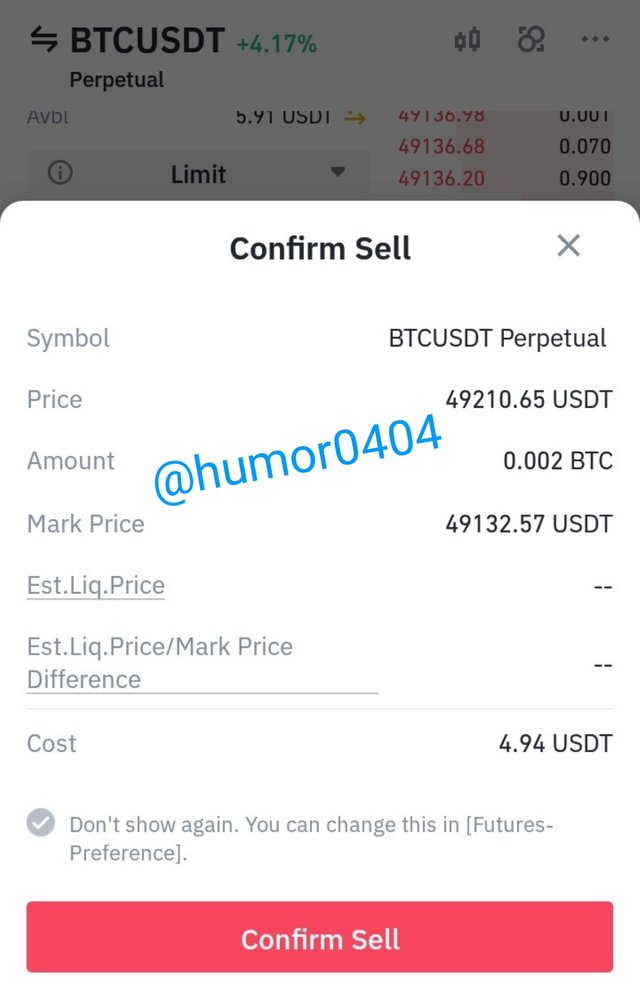
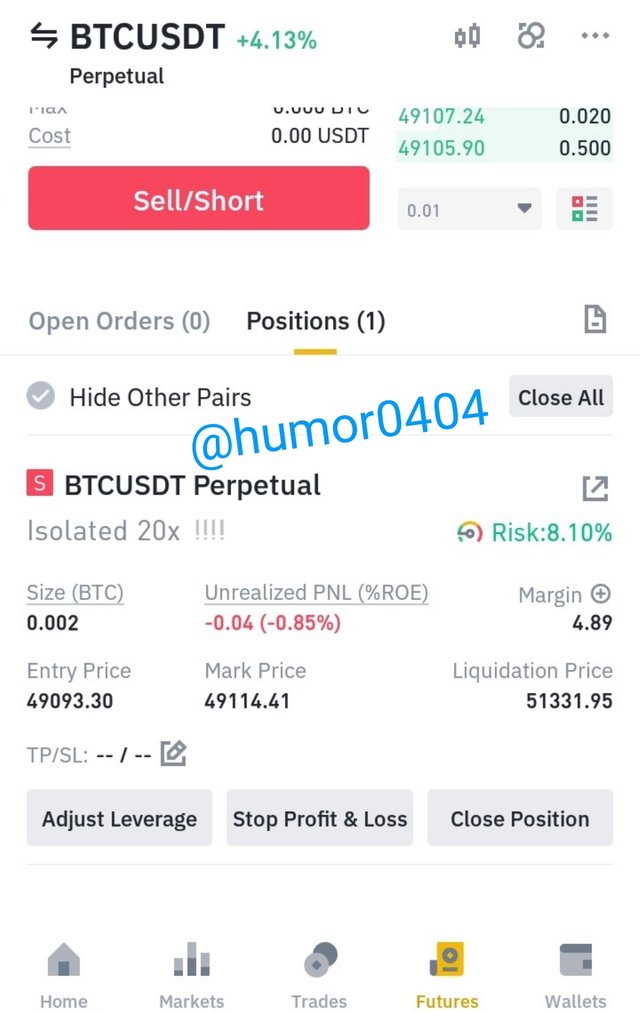
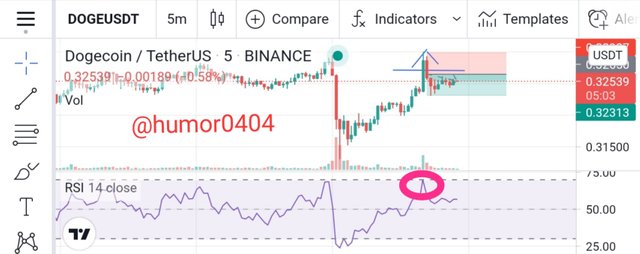
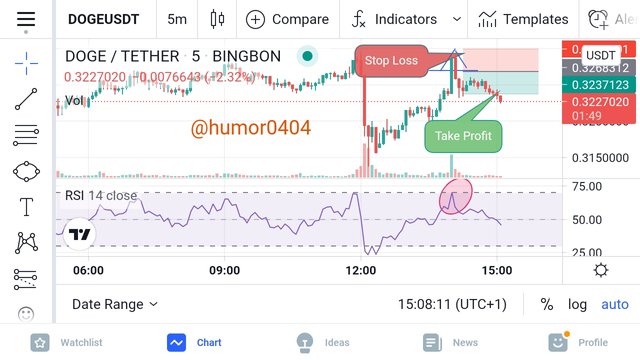
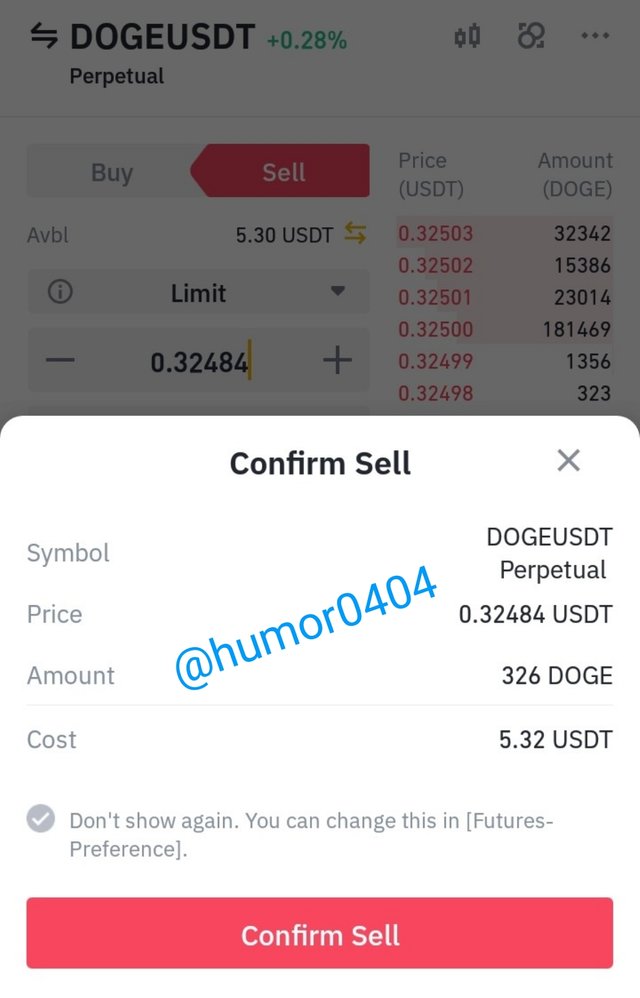
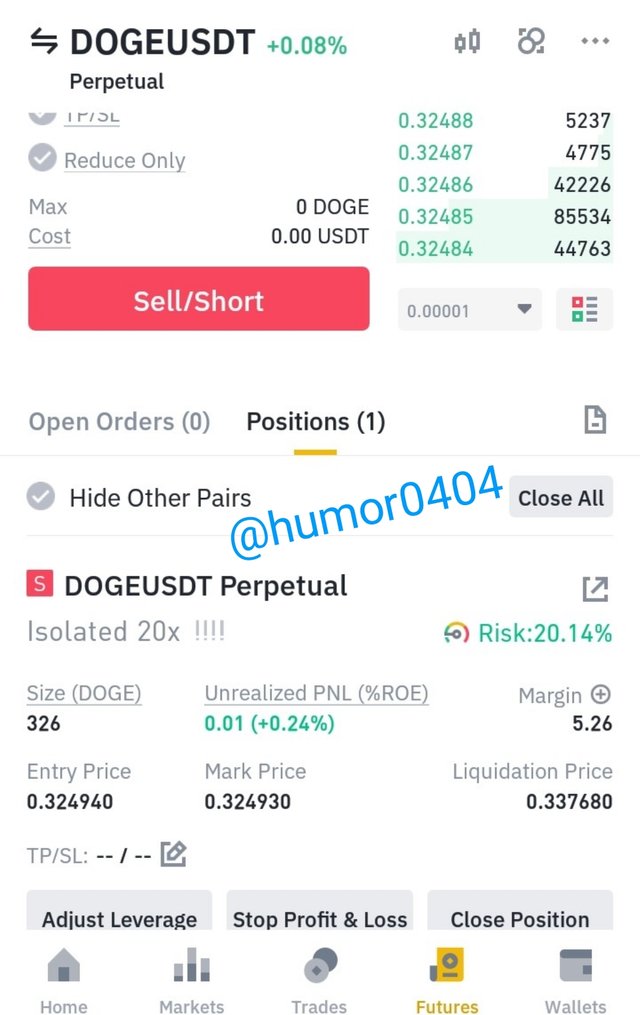
Here, I made use of Tradingview chart to confirm my setups, then I placed the actual trades in the market using Binance Futures. I used 1:1 Risk:Reward -
BTCUSD on 5 Minute Time Frame
DOGEUSDT on 5 Minute Time Frame
Conclusion
It's really nice learning about the Sharkfin pattern, and how to take advantage of it better using the RSI indicator. Also learning about the entry and exit criteria for trading the Sharkfin Pattern. This strategy is a very wonderful one, which traders can use to make profits from the markets. Thanks Professor @cryptokraze, for this nice lecture.
@steemcurator01, my article hasn't been curated