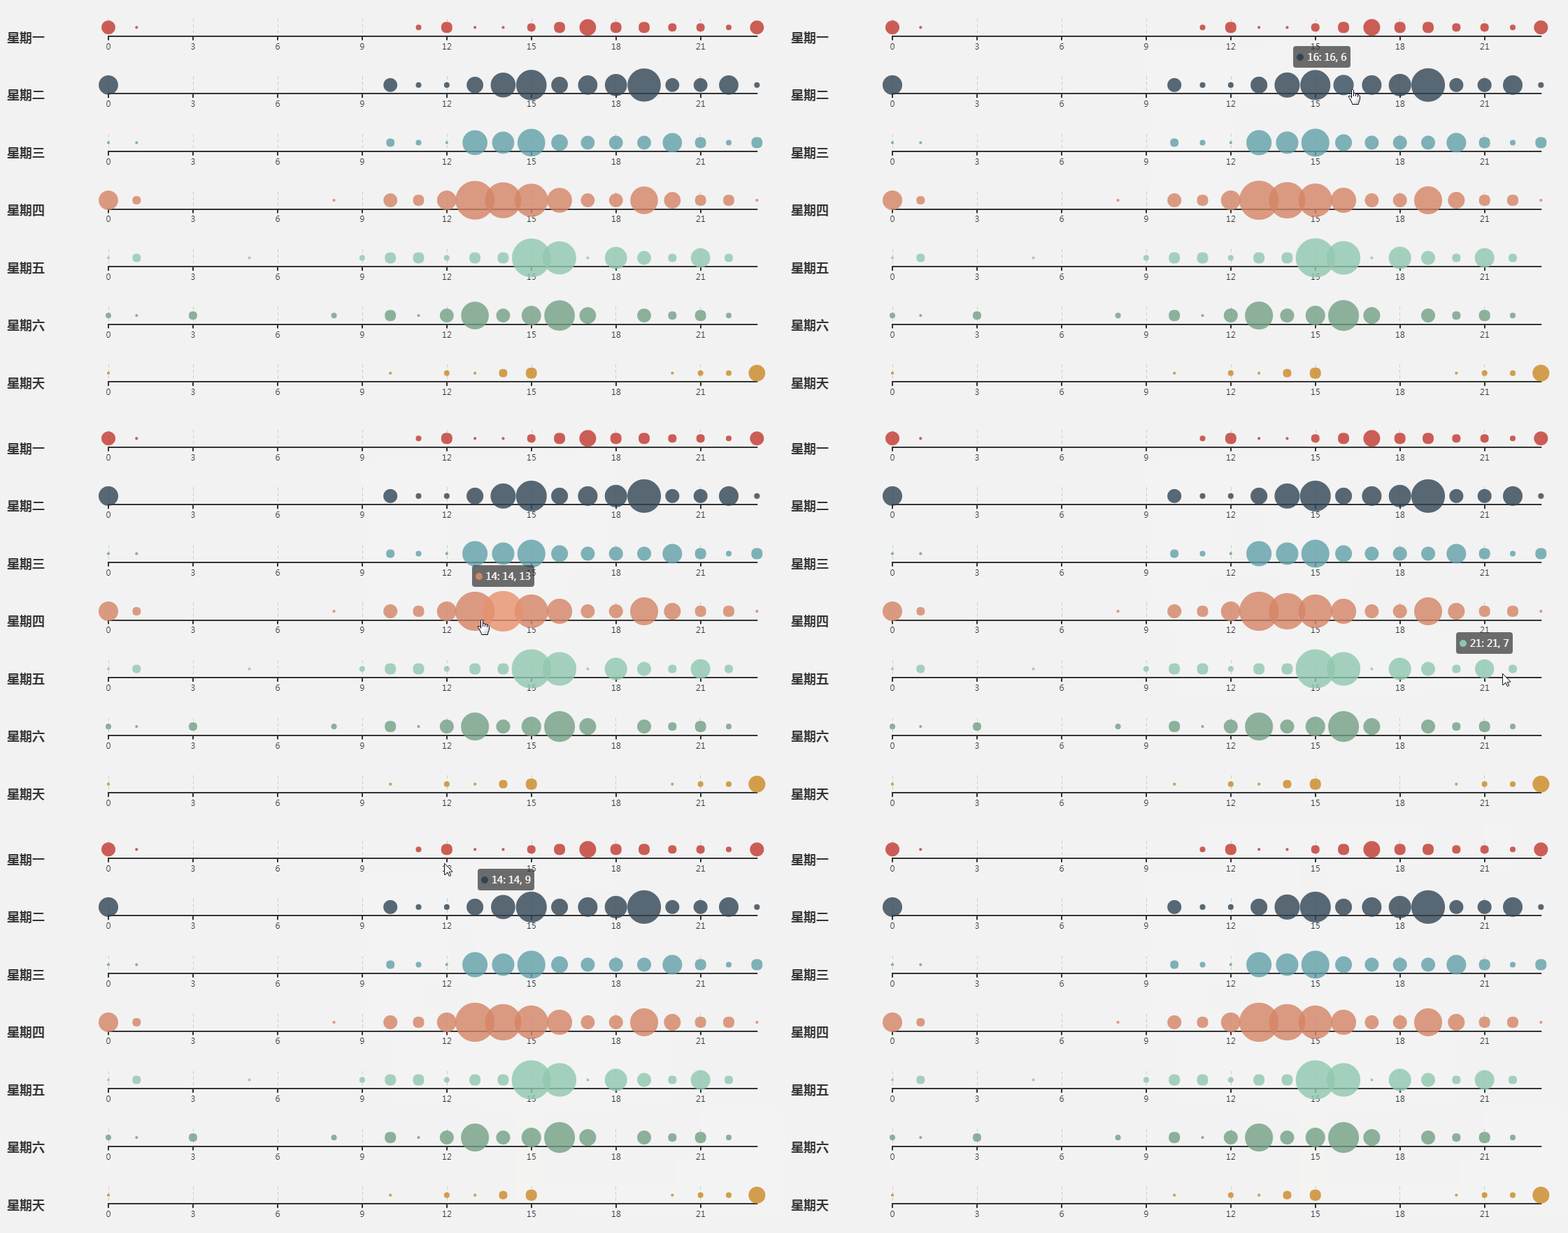
使用echarts创建X轴散点图/How to use echarts to make xAxis Scatter Point Chart
Summary:
echarts is a very good pure Javascript open source chart library that runs smoothly on PC and mobile devices and is compatible with most current browsers including IE8 / 9/10/11, Chrome, Firefox, Safari and others.
echarts是一款非常优秀的纯 Javascript 的开源图表库,可以在 PC 和移动设备上运行的很流畅,兼容目前大部分浏览器包括IE8/9/10/11,Chrome,Firefox,Safari等。
您将从这个教程中学到什么
- 如何定义x轴y轴值
- 如何定义数据值
- 如何定义提示框等
- 如何定义数据值显示
学习此教程的必备条件
- 你需要一个代码编辑器,比如Eclipse,EditPlus,EmEditor等等
- 你需要下载echarts.js,并在文件中调用
教程难度
- 容易
教程内容
演示效果

1. 知识点A - 如何定义x轴y轴值
var hours = ['0', '1', '2', '3', '4', '5', '6','7', '8', '9','10','11','12', '13', '14', '15', '16', '17','18', '19', '20', '21', '22', '23'];
var days = ['星期一', '星期二', '星期三','星期四', '星期五', '星期六', '星期天'];
使用数组方式定义X轴Y轴值,待用。
2. 知识点B - 如何定义数据值
var data = [[0,0,5],[0,1,1],[0,2,0],[0,3,0],[0,4,0],[0,5,0],[0,6,0],[0,7,0],[0,8,0],[0,9,0],[0,10,0],[0,11,2],[0,12,4],[0,13,1],[0,14,1],[0,15,3],[0,16,4],[0,17,6],[0,18,4],[0,19,4],[0,20,3],[0,21,3],[0,22,2],[0,23,5],[1,0,7],[1,1,0],[1,2,0],[1,3,0],[1,4,0],[1,5,0],[1,6,0],[1,7,0],[1,8,0],[1,9,0],[1,10,5],[1,11,2],[1,12,2],[1,13,6],[1,14,9],[1,15,11],[1,16,6],[1,17,7],[1,18,8],[1,19,12],[1,20,5],[1,21,5],[1,22,7],[1,23,2],[2,0,1],[2,1,1],[2,2,0],[2,3,0],[2,4,0],[2,5,0],[2,6,0],[2,7,0],[2,8,0],[2,9,0],[2,10,3],[2,11,2],[2,12,1],[2,13,9],[2,14,8],[2,15,10],[2,16,6],[2,17,5],[2,18,5],[2,19,5],[2,20,7],[2,21,4],[2,22,2],[2,23,4],[3,0,7],[3,1,3],[3,2,0],[3,3,0],[3,4,0],[3,5,0],[3,6,0],[3,7,0],[3,8,1],[3,9,0],[3,10,5],[3,11,4],[3,12,7],[3,13,14],[3,14,13],[3,15,12],[3,16,9],[3,17,5],[3,18,5],[3,19,10],[3,20,6],[3,21,4],[3,22,4],[3,23,1],[4,0,1],[4,1,3],[4,2,0],[4,3,0],[4,4,0],[4,5,1],[4,6,0],[4,7,0],[4,8,0],[4,9,2],[4,10,4],[4,11,4],[4,12,2],[4,13,4],[4,14,4],[4,15,14],[4,16,12],[4,17,1],[4,18,8],[4,19,5],[4,20,3],[4,21,7],[4,22,3],[4,23,0],[5,0,2],[5,1,1],[5,2,0],[5,3,3],[5,4,0],[5,5,0],[5,6,0],[5,7,0],[5,8,2],[5,9,0],[5,10,4],[5,11,1],[5,12,5],[5,13,10],[5,14,5],[5,15,7],[5,16,11],[5,17,6],[5,18,0],[5,19,5],[5,20,3],[5,21,4],[5,22,2],[5,23,0],[6,0,1],[6,1,0],[6,2,0],[6,3,0],[6,4,0],[6,5,0],[6,6,0],[6,7,0],[6,8,0],[6,9,0],[6,10,1],[6,11,0],[6,12,2],[6,13,1],[6,14,3],[6,15,4],[6,16,0],[6,17,0],[6,18,0],[6,19,0],[6,20,1],[6,21,2],[6,22,2],[6,23,6]];
使用数组方式定义数据值,待用。格式:[对应Y轴值,对应X轴值,定义数据值点大小]
3. 知识点C - 如何定义提示框等
    tooltip: {
        position: 'top'
    },
    title: [],
    singleAxis: [],
    series: []
- tooltip:定义提示框组件。
- position:定义提示框位置。
- title:定义标题组件。
- singleAxis:定义单轴。可以被应用到散点图中展现一维数据。
- series:定义系列列表。每个系列通过 type 决定自己的图表类型。
4. 知识点D - 如何定义数据值显示
echarts.util.each(days, function (tian, idtest) {
    option.title.push({
        textBase: 'middle',
        top: (idtest + 0.6) * 100 / 7 + '%',
        text: tian
    });
    option.singleAxis.push({
        left: 150,
        type: 'category',
        boundaryGap: false,
        data: hours,
        top: (idtest * 100 / 7 + 5) + '%',
        height: (100 / 7 - 10) + '%',
        axisLabel: {
            interval: 2
        }
    });
    option.series.push({
        singleAxisIndex: idtest,
        coordinateSystem: 'singleAxis',
        type: 'scatter',
        data: [],
        symbolSize: function (dataItem) {
            return dataItem[1] * 4;
        }
    });
});
echarts.util.each(data, function (dataItem) {
    option.series[dataItem[0]].data.push([dataItem[1], dataItem[2]]);
});
- textBase:定义文字位置基准。
- top:定义文字位置计算方法。
- text:定义显示标题文字。
- type:属性为category,定义为类目轴,适用于离散的类目数据,为该类型时必须通过 data 设置类目数据。
- boundaryGap:定义坐标轴两边留白策略,类目轴和非类目轴的设置和表现不一样。
- data:定义数据来源为hours。
- axisLabel:坐标轴刻度标签的相关设置。
- interval:坐标轴刻度标签的显示间隔,在类目轴中有效。默认会采用标签不重叠的策略间隔显示标签。
- singleAxisIndex:定义单个时间轴的index,默认值为0,因为只有单个轴。
- coordinateSystem:定义该系列使用的坐标系。
完整代码
var hours = ['0', '1', '2', '3', '4', '5', '6','7', '8', '9','10','11','12', '13', '14', '15', '16', '17','18', '19', '20', '21', '22', '23'];
var days = ['星期一', '星期二', '星期三','星期四', '星期五', '星期六', '星期天'];
var data = [[0,0,5],[0,1,1],[0,2,0],[0,3,0],[0,4,0],[0,5,0],[0,6,0],[0,7,0],[0,8,0],[0,9,0],[0,10,0],[0,11,2],[0,12,4],[0,13,1],[0,14,1],[0,15,3],[0,16,4],[0,17,6],[0,18,4],[0,19,4],[0,20,3],[0,21,3],[0,22,2],[0,23,5],[1,0,7],[1,1,0],[1,2,0],[1,3,0],[1,4,0],[1,5,0],[1,6,0],[1,7,0],[1,8,0],[1,9,0],[1,10,5],[1,11,2],[1,12,2],[1,13,6],[1,14,9],[1,15,11],[1,16,6],[1,17,7],[1,18,8],[1,19,12],[1,20,5],[1,21,5],[1,22,7],[1,23,2],[2,0,1],[2,1,1],[2,2,0],[2,3,0],[2,4,0],[2,5,0],[2,6,0],[2,7,0],[2,8,0],[2,9,0],[2,10,3],[2,11,2],[2,12,1],[2,13,9],[2,14,8],[2,15,10],[2,16,6],[2,17,5],[2,18,5],[2,19,5],[2,20,7],[2,21,4],[2,22,2],[2,23,4],[3,0,7],[3,1,3],[3,2,0],[3,3,0],[3,4,0],[3,5,0],[3,6,0],[3,7,0],[3,8,1],[3,9,0],[3,10,5],[3,11,4],[3,12,7],[3,13,14],[3,14,13],[3,15,12],[3,16,9],[3,17,5],[3,18,5],[3,19,10],[3,20,6],[3,21,4],[3,22,4],[3,23,1],[4,0,1],[4,1,3],[4,2,0],[4,3,0],[4,4,0],[4,5,1],[4,6,0],[4,7,0],[4,8,0],[4,9,2],[4,10,4],[4,11,4],[4,12,2],[4,13,4],[4,14,4],[4,15,14],[4,16,12],[4,17,1],[4,18,8],[4,19,5],[4,20,3],[4,21,7],[4,22,3],[4,23,0],[5,0,2],[5,1,1],[5,2,0],[5,3,3],[5,4,0],[5,5,0],[5,6,0],[5,7,0],[5,8,2],[5,9,0],[5,10,4],[5,11,1],[5,12,5],[5,13,10],[5,14,5],[5,15,7],[5,16,11],[5,17,6],[5,18,0],[5,19,5],[5,20,3],[5,21,4],[5,22,2],[5,23,0],[6,0,1],[6,1,0],[6,2,0],[6,3,0],[6,4,0],[6,5,0],[6,6,0],[6,7,0],[6,8,0],[6,9,0],[6,10,1],[6,11,0],[6,12,2],[6,13,1],[6,14,3],[6,15,4],[6,16,0],[6,17,0],[6,18,0],[6,19,0],[6,20,1],[6,21,2],[6,22,2],[6,23,6]];
option = {
    tooltip: {
        position: 'top'
    },
    title: [],
    singleAxis: [],
    series: []
};
echarts.util.each(days, function (tian, idtest) {
    option.title.push({
        textBase: 'middle',
        top: (idtest + 0.6) * 100 / 7 + '%',
        text: tian
    });
    option.singleAxis.push({
        left: 150,
        type: 'category',
        boundaryGap: false,
        data: hours,
        top: (idtest * 100 / 7 + 5) + '%',
        height: (100 / 7 - 10) + '%',
        axisLabel: {
            interval: 2
        }
    });
    option.series.push({
        singleAxisIndex: idtest,
        coordinateSystem: 'singleAxis',
        type: 'scatter',
        data: [],
        symbolSize: function (dataItem) {
            return dataItem[1] * 4;
        }
    });
});
echarts.util.each(data, function (dataItem) {
    option.series[dataItem[0]].data.push([dataItem[1], dataItem[2]]);
});
最终效果

系列课程
如果您喜欢我的教程,可以在我的个人档案页面,获取更多信息。
If you like my tutorial , You can check out your profile for more such tutorials.
您可以使用zqz-tutorial标签快速查看我发布的所有教程
You can use the "zqz-tutorial" tag to see all the tutorials I've posted.
Posted on Utopian.io - Rewarding Open Source Contributors
Thank you for the contribution. It has been approved.
You can contact us on Discord.
[utopian-moderator]
ok~I have modified.
I only retained this sentence.
如果您喜欢我的教程,可以在我的个人档案页面,获取更多信息。
If you like my tutorial , You can check out your profile for more such tutorials.
Copied from https://ecomfe.github.io/echarts-examples/public/editor.html?c=scatter-single-axis
You can contact us on Discord.
[utopian-moderator]
Hey @hui.zhao I am @utopian-io. I have just upvoted you!
Achievements
Suggestions
Get Noticed!
Community-Driven Witness!
I am the first and only Steem Community-Driven Witness. Participate on Discord. Lets GROW TOGETHER!
Up-vote this comment to grow my power and help Open Source contributions like this one. Want to chat? Join me on Discord https://discord.gg/Pc8HG9x