STEEM chart analysis
easy and simple: there are good and bad signs in every chart, we need to know and measure them.
STEEMUSD
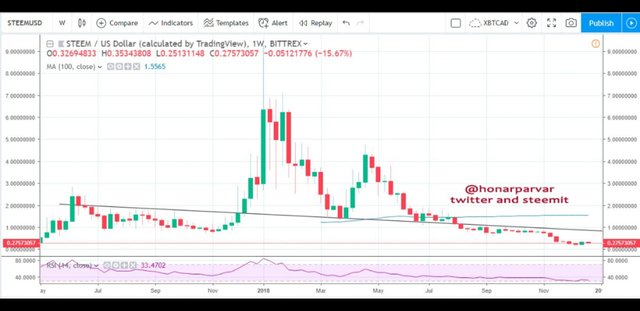
the bad thing is the market is still in a downtrend. and there areno good news from Crypto market to help it.
STEEM is below 100 wma for a while and also a trend line I have drawn based on weekly chart. and the bearish momentum still continues.
Scenario: STEEM will continue weak sideways till the RSI14 shows an oversold, then there will be a test to resistance levels above: my drawn line which easily can break and then the weekly moving average.
there will be more than one testing for sure. so corrections should be considered failure.
XBTCAD analysis in thr next post. stay in touch.
