Bear Trap in Bitcoin weekly chart
as it is 16th June 2020, we have this in weekly chart of BTC:
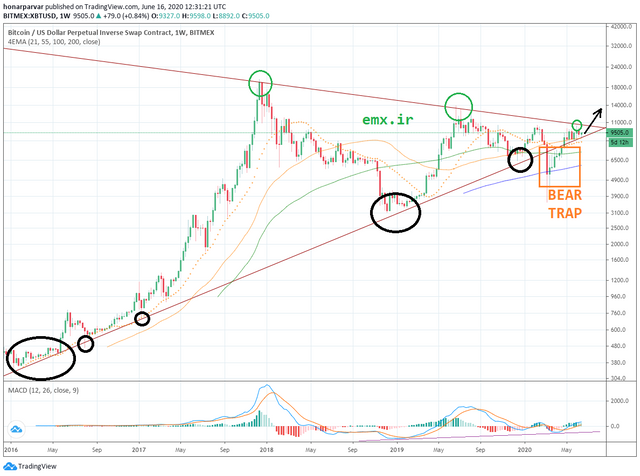
an all time up-trend with too many confirmations as the support and a midterm down trend (starting the famous All Time High, ATH, of Bitcoin) confirmed enough multiple times to be credible.
during the pandemic and the fear of world economy crisis, we had that down break out which was supported by the EMA200 and then multiple rising candles which all confirms a bear trap.
MACD also shows good momentum for continuing the uptrend.
overall, I'm still bullish on BTC and I hold a position at the moment.
don't forget, it's not a financial advice, it's just my opinion and I'm looking forward your comments to learn more and correct myself.
I have also posted this on my other social media accounts. my username is same everywhere: @honarparvar