Understanding Trends - Crypto Academy / S5W1- Homework Post for @reminiscence01
Hey Steemit!
Here is my homework post for Professor @reminiscence01. This is undoubtedly a great lesson, and I hope that you will enjoy reading this post.

1) a) What do you understand by a Trending market?
The trend is an essential part of the market as it defines the movement of the price asset in the market. Therefore, the knowledge of the market trend is necessary for a trader as it helps him identify the direction in which the price is moving and thus take the trade accordingly.
If we talk about the price movement of an asset in the market, it is seen to be moving in two ways. It either moves in a range or a trend. So we call the two movements, trending and *ranging. If we talk about a trending market, we see the market moving in the upward direction or the downward direction. The trend in which the price moves in the upward direction is called an *uptrend. The trend in which the price moves in the downward direction is called a downtrend.
The market makers control trends. The buyers and the sellers rule the market. Now let’s talk about the effect of the domination of buyers and sellers in the market trend. If the buyers are dominating the market, the price will move in an uptrend. Similarly, if the sellers are dominating the market, the price is will move in a downtrend.
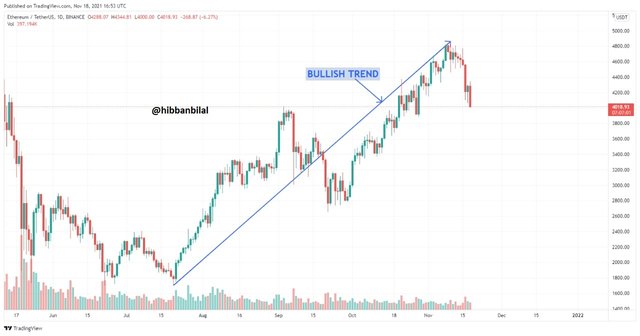
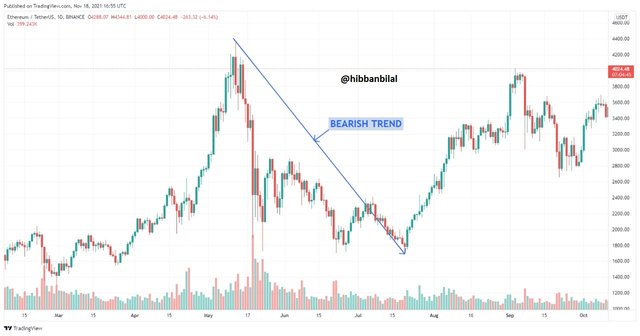
b) What is a bullish and a bearish trend? (Screenshot required)
Bullish Trend
We previously discussed the two directions in the trending market. The directions were uptrend and downtrend. If an asset's price is moving in an uptrend, it is also called to be following a bullish trend. This means that an uptrend is also known as a bullish trend. The domination of the buyers leads to the market moving in a bullish direction.
Bearish Trend
Similarly, when an asset's price moves in a downtrend, it is called to be following a downtrend. Therefore, a downtrend and a bearish trend are the same things. The domination of sellers in the market causes a bearish trend.
2) Explain the following trend identification and give an example of each of them. (Original screenshot needed from your chart). Do this for a bullish and a bearish trend.
i) Market Structure.
ii) Trendlines
Market Structure
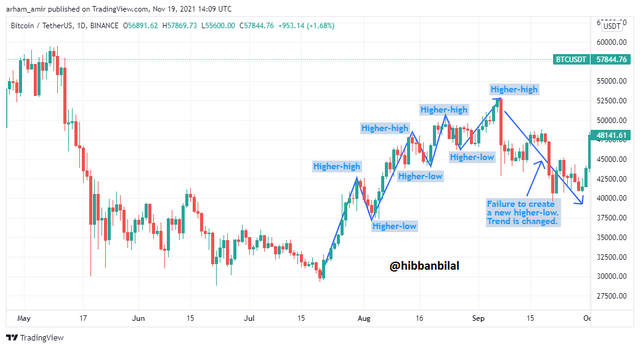
Market structure is a way through which you can identify what direction the market is following. You can identify whether the market is moving in an uptrend or downtrend or ranging. The market's direction can be identified by identifying patterns that the candlesticks are making on the chart. The candlesticks make different patterns to indicate different trends that the market is following.
Market Structure in a Bullish Trend
Now let’s talk about the market structure indicating a bullish trend. First of all, the market will be seen moving in an upward direction. We will see the candlesticks forming higher highs and higher lows. Every high must be higher than the previous high, and every low must be higher than the previous low. If the market fails to continue the pattern mentioned above, then the pattern will be invalidated, and the market will most likely see a reversal in the trend. For example, if the market makes a low below the previous low in a bullish trend, then the last pattern will be invalidated, and there will be a reversal in the market. An example of the market structure in a bullish trend is shown in the chart below.
.png)
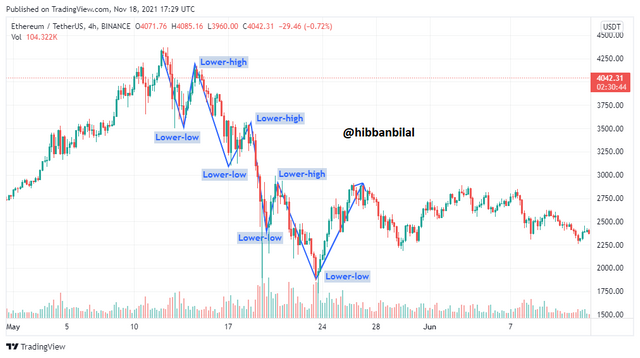
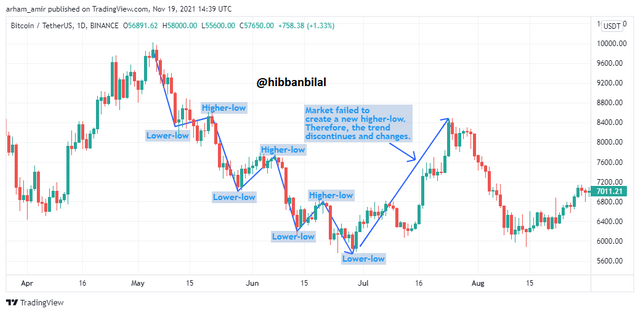
Market Structure in a Bearish Trend
We know that the candlesticks form different patterns to indicate different patterns; we know that the pattern indicating a bearish trend is different. The market, in a bearish trend, will be seen to be moving in the downward direction. It will make lower lows and lower highs. Here too, there are some restrictions for the pattern to stay valid. Every lower-low must be lower than the previous low, and every lower-high must be lower than the previous high. A failure to meet the above condition will invalidate the pattern and cause a reversal in the market trend. For example, if a high is formed above the previous high in a bearish trend, the pattern will be invalidated, and the trend will be reversed, thus starting a bullish trend.
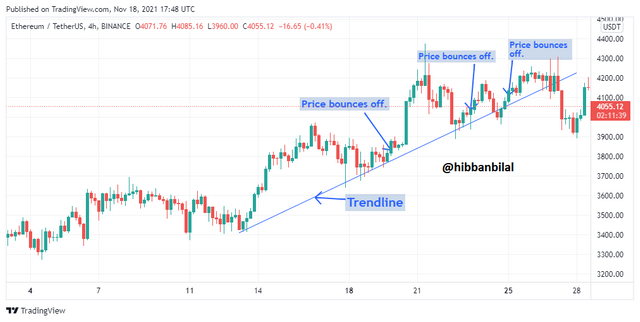
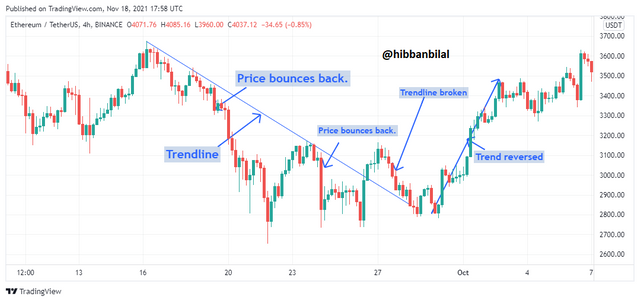
Trendlines
We now know that the knowledge of market structures is essential for a trader to have. There is another tool called trendlines that helps you understand the market trend like market structures. A trendline is very simple to form. You need two low points in case of an uptrend. Similarly, if we talk about forming a trendline in a downtrend, you need two high points. Trend reversal can also be identified through trendlines. If the candlesticks break the trendline, this means that there may be a reversal, and the previous trend has been invalidated.
Trendlines formed in a bullish trend
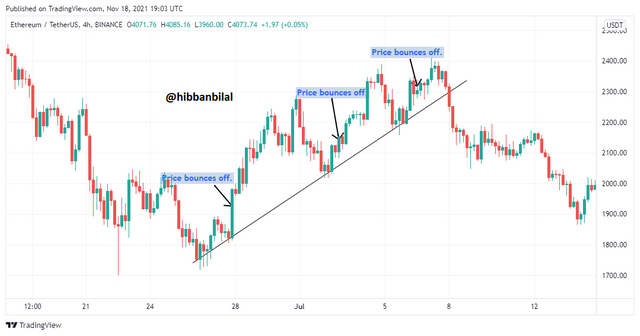
If we talk about the trendline formed on a bullish trend, the price here moves above the trendline. Here, a trendline needs to have at least two low points to be valid. Every time the price touches the trendline, it bounces back. The trendline in case of a bullish trend is called to be a support. If the price fails to bounce back and breaks the trendline, it indicates that the trend has been invalidated, and a reversal is expected. An example of a trendline formed in a bullish trend is shown in the screenshot below.
Trendlines formed in a bearish trend
A trendline in a bearish trend is formed by joining at least two high points. The price is seen to be moving below the trendline here. Like the trendline in a bullish trend, the price in a bearish trend also bounces as it touches the trendline. The trendline in a bearish trend is called to be a resistance. If the price breaks the trendline, it is an indication that the trend has been invalidated, and a reversal in the price is expected. Below is an example of a trendline formed in a bearish trend.
3) Explain trend continuation and how to spot them using market structure and trendlines. (Screenshot needed). Do this for both bullish and bearish trends.
Trend Continuation
The price action in the market has fluctuations, and it does not travel in a straight line. Previous resistances or supports are seen to be broken; then, retracements are also noticed. This is essential for the continuation of the trend, and thus the price action does not move in a straight line. Through both market structure and trendlines, trend continuation can be spotted.
Spotting Trend Continuation through Market Structure
Bullish Trend Continuation
We know that in a bullish trend, higher highs and higher lows are made. Therefore, for a trend to continue and stay valid, the current higher-high must be higher than the previous higher-high, and the current lower-high must be higher than the previous lower-high. As long as the market keeps following this condition, the trend will keep continuing. But if a higher-high is formed below the previous higher-high, this means that the trend may no longer continue and that it is invalidated. An example of bullish trend continuation is shown in the chart below.
Bearish Trend Continuation
Now let’s talk about spotting the continuation of the bearish trend through the market structure. A bearish trend is observed when there are lower lows and lower highs made. If this trend needs to stay valid, it has to form the current lower-low below the previous lower-low. Also, it has to form the current higher-low below the previous higher-low. So the market would continue to move in a bearish trend as long as the condition is met. But if the situation is not met, then the trend may no longer continue. An example of a bearish trend continuation is shown in the chart below.
Spotting Trend Continuation through Trendlines
Bullish Trend Continuation
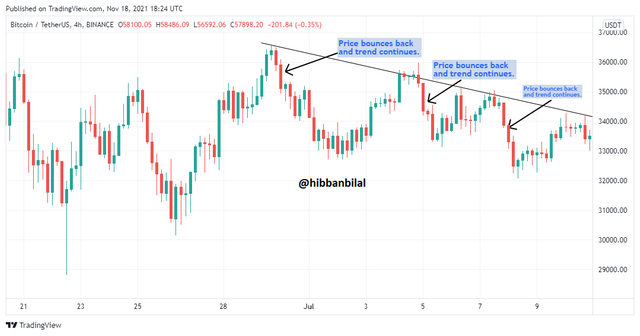
In a bullish trend, we draw a trendline by joining at least two of the lows. Now let’s talk about how we can spot if the trend is continued. The trendline is valid as long as the price action bounces back from it and does not break it. This means that new lows are being made, and all of them follow the trendline pattern. So as long as the price keeps bouncing off the trendline and does not break it, our bullish trend will continue. But if the price action breaks the trendline, the trend may no longer continue.
Bearish Trend Continuation
We have discussed earlier that a trendline in a bearish trend is formed by joining at least two highs. Therefore, we need to see how the price moves with the trendline to spot the continuation of a bearish trend through the trendline. This means as long as the price respects the trendline and keeps bouncing back off the trendline, the trend will remain to be valid. Therefore, the trend will keep continuing. But if the price breaks the trendline, the trend may no longer continue.
4) Pick up any crypto-asset chart and answer the following questions.
Is the market trending?
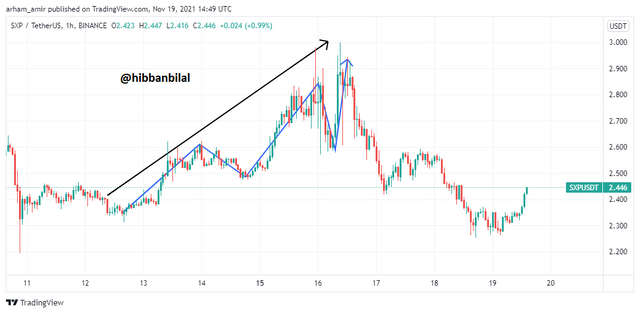
I have chosen the SXP/USDT pair for this question. Looking at the 1-hour chart, we notice that the price action has been moving in a bearish trend. Therefore, we can say that the price moves in a downtrend while forming lower lows and lower highs.
What is the current market trend? (Use the chart to back up your answers).
The chart below shows that the market was forming higher highs and higher lows traveling in a bullish trend. However, as the market created the final higher high at around 2.9, it failed to create the next higher-low, and the price dropped to 2.416.
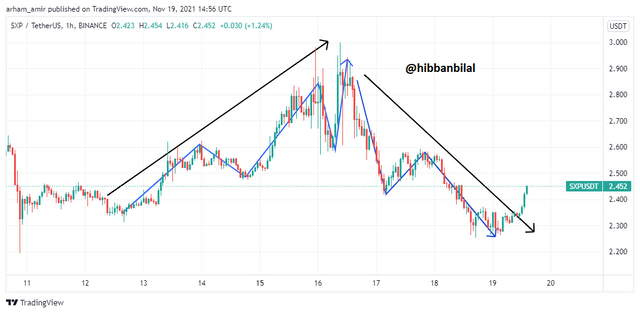
The point where the price drops to 2.416 is considered as the lower low. After that, in the chart below, we can see the formation of higher lows and lower lows on the chart. Therefore, we can say that the market is traveling in a bearish trend as the previous trend was invalidated.
Conclusion
The knowledge of market trends, market structure, and trendlines is essential for a trader. These are the basic components of technical analysis and can be helpful. They are easy to understand and would be very beneficial to traders, especially beginners. However, technical analysis and the execution of a trade cannot be only dependent on this knowledge. These could be used with other confluences to do technical analysis. It was a great lesson, and I appreciate the work of Professor @reminiscence01. Thank you!
Hello @hibbanbilal, I’m glad you participated in the 1st week Season 5 of the Beginner’s class at the Steemit Crypto Academy. Your grades in this task are as follows:
Recommendation / Feedback:
Thank you for participating in this homework task.
@steemcurator02
@steemcurator02
@steemcurator02
@steemcurator02
@steemcurator02